|
|
| Пишет iv_g ( @ 2010-09-28 19:20:00 |
|
|
|
|
|
|
|
|
|
|
|
|
|
|
| Entry tags: | eia.doe.gov, Австралия, диаграмма, обзор страны, промышленность горнодобывающая |
Австралия: Горнодобывающая промышленность
Australia
http://www.eia.doe.gov/cabs/australia.h
Economic Roundup Spring 2005
Mining and commodities exports
Introduction
The mining sector accounted for around $43 billion, or 5 per cent, of Australia’s GDP in 2004-05.
The historical development of Australia’s resources sector
The first mineral resource discovered in Australia was coal, found in 1796 in the region later called Newcastle (after the English coal port), with the first exports (to Bengal) occurring in 1799. By the 1840s, copper was being mined by Cornish immigrants near Adelaide and the first iron ore was being smelted at Mittagong. However mining really only came to prominence during the gold rush of the 1850s, which occurred predominantly in Victoria (Chart 2). This saw the population of Victoria soar from under 100,000 to over half a million in the space of a decade.
Following further discoveries at Kalgoorlie in the 1890s, gold still accounted for the majority of mining production in the early years of federation — with Australia being the world’s leading gold miner in some years. However, copper, lead and silver (notably from the mines at Broken Hill) had also become important. The end of World War I saw metal prices collapse and many mines closed.
Chart 2: Mining activity
Long-term trends in relative commodity prices
Over the period since 1850, the oft-cited Economist index of commodity prices7 dropped by around 80 per cent relative to overall prices. However, overall mineral resource prices have increased relative to the prices of manufactures over the past half-century (Chart 3). This period has been dominated by supply shocks driving up oil prices in the 1970s and the more recent increases in prices driven largely by demand (discussed further below). From the mid-1990s the increase in relative commodity prices has been reinforced by falls in prices of manufactures.
Chart 3: Relative price of global mining exports
(World mining export prices / manufactures exports)
Chart 4: Relative price of coal (US dollar price of coal exports relative to US CPI)
Cyclical variations in commodity prices
Chart 5: World GDP and mining production
Chart 6: World minerals production and exports
Chart 7: World mining export prices
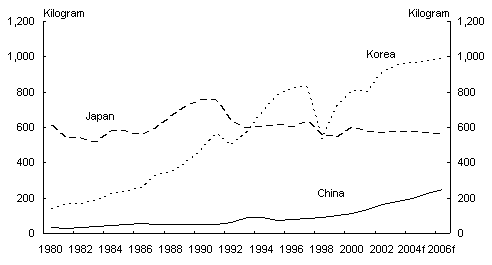
Chart 10: Per capita consumption of finished steel
http://www.treasury.gov.au/documents/10
http://www.peakoil.org.au/charts/in
- - - - - - - - - - - - - - - - - -
100 years of change in Australian industry
http://www.abs.gov.au/Ausstats/abs@
The Australian Coal Industry - Coal Exports
http://www.australiancoal.com.au/the-au
Mining History Network .. Other Web Sites and Online Resources
http://projects.exeter.ac.uk/mhn/www.ht
http://www.worldcoal.org/home/


