[Most Recent Entries] [Calendar View] [Friends]
Below are the 11 most recent journal entries recorded in
iv_g's LiveJournal:
| Saturday, December 18th, 2010 | |
| 5:15 pm | Канада: National Energy Board The National Energy Board (NEB or Board) is an independent federal agency established in 1959 by the Parliament of Canada to regulate international and interprovincial aspects of the oil, gas and electric utility industries. The purpose of the NEB is to regulate pipelines, energy development and trade in the Canadian public interest. http://www.neb-one.gc.ca/clf-nsi/rt Total Crude Oil Exports - Annual (1993-2010) http://www.neb-one.gc.ca/clf-nsi/rnrgyn Estimated Production of Canadian Crude Oil and Equivalent (1998-2010) http://www.neb-one.gc.ca/clf-nsi/rnrgyn Natural Gas Exports and Imports Summary http://www.neb-one.gc.ca/clf-nsi/rnrgyn Frontier and Offshore Regulatory Renewal Initiative (FORRI) http://www.neb-one.gc.ca/clf-nsi/rpblct Speeches and Presentations http://www.neb-one.gc.ca/clf-nsi/rpblct Canadian Energy Facts http://www.neb-one.gc.ca/clf-nsi/rpblct Energy Reports http://www.neb-one.gc.ca/clf-nsi/rnrgyn Energy Overview http://www.neb-one.gc.ca/clf-nsi/rnrgyn Oil Sands http://www.neb-one.gc.ca/clf-nsi/rnrgyn |
| 2:00 pm | Liquefied Natural Gas - A Canadian Perspective - Energy Market Asssessment An Energy Market Assessme nt FEBRUARY 2009 http://www.neb-one.gc.ca/clf-nsi/rnrgyn http://www.neb-one.gc.ca/clf-nsi/rnrgyn Conversion Factors 1 m3 gas = 35.3 cubic feet of natural gas 1 m3 LNG = 21,824 cubic feet of natural gas 1 Tonne LNG = 47,257 cubic feet of natural gas 1 Figure 1.1 - LNG Share of World Natural Gas Market  Source: BP Statistical Review of World Energy 2 Figure 1.2 - Global Natural Gas Consumption and Outlook  Source: EIA International Energy Outlook 2008 3 Figure 1.3 - Natural Gas Balance in Major Consuming Markets  Source: BP Statistical Review of World Energy 4 Figure 2.1 - Estimated Natural Gas Reserves (2007)  Source: IEA 2008 5 Figure 2.2 - World Production and Consumption of Natural Gas (2007) 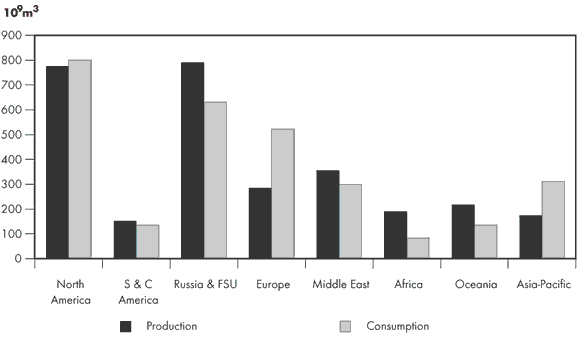 Source: BP Statistical Review of World Energy 6 Figure 2.3 - Growing Reliance on Natural Gas Imports  Source: EIA International Energy Outlook 2008 7 Figure 2.4 - World LNG Production  Source: BP Statistical Review of World Energy 8 Figure 2.5 - Major LNG Producing and Consuming Regions (2007) - 109m3  Source: BP Statistical Review of World Energy 9 Figure 2.6 - World LNG Markets  Source: BP Statistical Review of World Energy 10 Figure 2.7 - East-Asia Natural Gas Balance  * Predominately From China Source: BP Statistical Review of World Energ 11 Figure 2.8 - East-Asia Seasonal LNG Requirement  Source: Various data sources 12 Figure 2.9 - LNG Supply to Japan  Source: Japan Ministry of Finance 13 Figure 2.10 - Natural Gas Production and Consumption in Major East-Asian Countries*  * Includes Japan, South Korea and China Source: EIA International Energy Outlook 2008, September 2008 14 Figure 2.11 - European Natural Gas Production  Source: BP Statistical Review of World Energy 15 Figure 2.12 - European Natural Gas Balance  Source: BP Statistical Review of World Energy 16 Figure 2.13 - North American Natural Gas Balance  Source: BP Statistical Review of World Energy 17 Figure 2.14 - World Market Influence on U.S. LNG Imports  * Converted to US$/MMBtu from data derived from the InterContinental Exchange (ICE) and the Japan Ministry of Finance 18 Figure 2.15 - Global LNG Liquefaction and Regasification Outlook  19 Figure 2.16 - Global LNG Liquefaction Under Construction  20 Figure 2.17 - LNG Shipping Fleet  Source: Argus and NEB estimates 21 Figure 2.18 - Atlantic Basin LNG Development  22 Figure 2.19 - Asia-Pacific Basin LNG Development  23 Figure 2.20 - Middle East LNG Liquefaction  24 Figure 3.1 - North American Natural Gas Consumption and LNG Imports  Sources: Historical from BP, Projection from EIA International Outlook 2008 with adjustment from 2009 Annual Energy Outlook 25 Figure 3.2 - U.S. LNG Imports  Source: U.S. Department of Energy 26 Figure 3.3 - Natural Gas Production and Consumption in North America  Sources: EIA International Energy Outlook 2008 and Annual Energy Outlook 2009 27 Figure 3.4 - Natural Gas Production and Consumption in Europe  Source: EIA International Energy Outlook 2008 28 Figure 3.5 - U.S. LNG Imports and Atlantic Basin Competition  Sources: Intercontinental Exchange, U.S. Department of Energy 29 Figure 3.6 - Atlantic Basin LNG Supply and North American Imports  Source: NEB estimates 30  31 Figure 4.2 - Illustrative Transportation Costs to Atlantic Basin Markets  Source: NEB 32 Figure 4.3 - New England Natural Gas Consumption and LNG Imports  Source: EIA 33 Figure 4.4 - Illustrative Transportation Costs to Asia-Pacific Basin Markets  Source: NEB 34  35  36  |
| Thursday, December 16th, 2010 | |
| 11:10 am | "Атомредметзолото" покупает австралийскую урановую компанию Mantra Resources за $1,2 млрд Принадлежащее "Росатому" "Атомредметзолото" приобретает уже вторую крупную зарубежную урановую компанию. Вслед за 51% акций канадской Uranium One, АРМЗ хочет получить 100% акций австралийской Mantra Resources за $1,2 млрд. При этом и принадлежащее Mantra месторождение Мкужу Ривер в Танзании, и ряд других зарубежных активов, которыми интересуется АРМЗ, потребуют дополнительных инвестиций. "Атомредметзолото" (АРМЗ, входит в состав "Росатома") продолжает скупку уранодобывающих активов за рубежом. Вчера компания объявила о достижении договоренности о приобретении австралийской Mantra Resources Ltd, владеющей правами на танзанийское месторождение Мкужу Ривер. За этот актив АРМЗ намерена заплатить 1,2 млрд австралийских долларов (текущий курс этой валюты практически равен доллару США). В компании не пояснили, будут это собственные средства АРМЗ или заемные. Акционеры Mantra получат по $8 за акцию. Это на 15,5% выше средневзвешенной цены акций компании за последние 20 дней, и на 21,2% выше средневзвешенной цены за месяц, говорится в сообщении Mantra. Ориентировочная дата закрытия сделки — 29 апреля 2011 года. Мкужу Ривер — месторождение на юге Танзании, доказанные запасы составляют около 40 тыс. тонн урана. Средняя глубина залегания — около 60 м, содержание урана в руде — до 0,044%, себестоимость добычи — менее $80 за кг. После освоения месторождения ежегодная добыча должна составлять до 2500 тыс. тонн. Mantra планировала инвестировать в Мкужу Ривер $298 млн (в том числе $140 млн в завод по переработке руды). Сейчас окончательное ТЭО проекта еще не завершено, ввести в строй первую очередь проекта Mantra собиралась к началу 2013 года. Это уже вторая крупная сделка АРМЗ в этом году, ранее компания приобрела 51% акций канадской Uranium One (сделку планируется закрыть до конца года) за доли в казахских уранодобывающих активах (50% СП "Акбастау" и 49,7% СП "Заречное") и $610 млн. Кроме того, во вторник были подписаны документы о создании СП с Монголией по работе на месторождении "Дорнод" (АРМЗ получит 49% акций), размер необходимых инвестиций пока не назывался. АРМЗ интересуется и другими активами за рубежом, в частности, компания вела переговоры о месторождениях в Намибии. В приобретении Mantra также примет участие Uranium One (U1): после завершения сделки она будет оператором проекта Мкужу Ривер. Кроме того, канадская компания заключила опционное соглашение о возможном приобретении в течение года у АРМЗ всех акций Mantra. В случае исполнения опциона АРМЗ должна получить ту же сумму, которую потратит на сделку по приобретению Mantra. U1 также покроет дополнительные расходы российской компании и надбавку в размере 2,65% годовых. Эту покупку должны одобрить акционеры U1. Для завершения сделки по приобретению Mantra АРМЗ необходимо получить ряд разрешений от властей и судов Австралии, а также одобрение собрания акционеров австралийской компании. Один из крупнейших акционеров Mantra — компания Highland Park (по данным самой Mantra — 12,4% акций, по данным U1 — более 13%) — уже успела уведомить совет директоров о том, что намерена голосовать за сделку. Акционерный капитал компании раздроблен, 20 владельцев крупнейших пакетов контролируют в совокупности около 89% акций. Среди других акционеров со значительными долями в документах Mantra упоминаются Deans Knight Capital Management Ltd (8,8%), Haywood Securities (6,15%), JP Morgan Asset Management UK Ltd (5,15%). АРМЗ приобретает "средний по величине актив, но очень хорошего качества", говорит Михаил Стискин из "Тройки Диалог". По мнению аналитика, цена за Mantra довольно высока, но здесь надо учитывать то, что потенциальных объектов для приобретения на урановом рынке очень мало. Основным техническим риском сделки господин Стискин считает то, что пока по проекту Мкужу Ривер нет полного ТЭО. Марина Алексеенкова из "Ренессанс Капитал" полагает, что в данном случае АРМЗ инвестирует скорее в значительные запасы уранового сырья, поскольку освоить месторождение только предстоит. http://www.kommersant.ru/doc.aspx?DocsI |
| Saturday, November 13th, 2010 | |
| 5:00 pm | ОПЕК: Taxes on Oil  http://www.opec.org/opec_web/en/data_gr Who gets what from imported oil, ноябрь 2010     http://www.opec.org/opec_web/en/publica http://www.opec.org/opec_web/static_fil |
| Tuesday, November 2nd, 2010 | |
| 9:45 am | Аляска Площадь Всего - 1 717 854 км² Суши - 1 481 347 км² Воды - 236 507 км² Население - Всего (2000) - около 700 тыс. чел - Плотность - 0,42/км² Стал штатом 3 января 1959 (49-м по порядку) Города с населением более 100 000 человек - Анкоридж Города с населением 10 000 — 100 000 человек - Фэрбенкс, Джуно (столица штата), Колледж http://ru.wikipedia.org/wiki/Аляск Административно-территориальное деление Аляски  ( Read more... ) http://www.digital-topo-maps.com/co http://ru.wikipedia.org/wiki/Аляск Карты http://www.alaskamapsite.com/alaska_map http://geography.about.com/gi/dynamic/o   http://en.wikipedia.org/wiki/Alaska ALASKA VOLCANO OBSERVATORY http://www.avo.alaska.edu/  http://geology.com/state-map/alaska.sht  ( 3000×2250 )  http://g-to-g.com/index.php?version=r  http://www.cosasco.com/technical_pa http://www.cosasco.com/pdfs/remote_moni  http://travelingwithkatydid.blogspot.co Геотермальная карта Аляски http://smu.edu/geothermal/heatflow/Alas Energy profile of Alaska, United States http://www.eoearth.org/article/Energy_p http://tonto.eia.doe.gov/state/state_en Alaska North Slope Oil Production. March 21, 2010  http://wilco278.wordpress.com/2010/03/2   http://en.wikipedia.org/wiki/Alaska Prospects for Alaskan Oil...In 1920 http://www.theoildrum.com/node/4738 Prudhoe Bay Oil Field http://en.wikipedia.org/wiki/Prudhoe_Ba Natural gas in Alaska Alaskan gas wells are located in two regions. The largest source is the North Slope area around Prudhoe Bay where gas was discovered along with oil in 1968. In 1974 the State of Alaska's Division of Geological & Geophysical Surveys estimated that the field held 26×1012 cu ft (740 km3) of natural gas. Because there is no way to transport the Prudhoe Bay gas to markets, as gas comes out of the wells, it is separated from the oil stream and reinjected into the ground to maintain the oil reservoir pressures. There are several proposals to transport the Prudhoe Bay gas. See, Alaska Gas Pipeline. The second source is located on the Kenai Peninsula on the South coast of Alaska. There are probable gas reserves of 1,726.4 Bcf in this area. Most of this gas is exported to Japan through a liquefied natural gas terminal located on the Cook Inlet. The Cook Inlet basin contains large oil and gas deposits including several offshore fields. As of 2005 there were 16 platforms in Cook Inlet, the oldest of which is the XTO A platform first installed by Shell in 1964, and newest of which is the Osprey platform installed by Forest Oil in 2000. Most of the platforms are operated by Union Oil which was acquired by Chevron in 2005. There are also numerous oil and gas pipelines running around and under the Cook Inlet. http://en.wikipedia.org/wiki/Natural_ga Alaska Oil Production, 2007  http://wilco278.wordpress.com/2008/07/2   http://thestandard.org.nz/the-suppl http://www.energywatchgroup.org/fileadm 11.02.2009  http://nextbigfuture.com/2009/02/califo 2007 Аляска http://www.gravmag.com/alaska.shtml http://pubs.usgs.gov/fs/fs-0028-01/fs-0 Trans-Alaska Pipeline System   http://en.wikipedia.org/wiki/Trans-Alas Alaska gas pipeline http://en.wikipedia.org/wiki/Alaska_Gas Золотая лихорадка на Аляске началась в 1896—1897 гг. На Аляске самые крупные жилы были обнаружены в Номе в 1898 г. и около Фэрбэнкса в 1902 году. В общей сложности более чем за век с момента находки жилы было добыто и вывезено около 12,5 миллионов унций (20,12м³) золота. По данным 2008 года его суммарная стоимость составляет 4.4 миллиарда долларов США. http://ru.wikipedia.org/wiki/Клондайкск Gold mining in Alaska http://en.wikipedia.org/wiki/Gold_minin Bonanza Creek GIS/Remote Sensing Page http://www.lter.uaf.edu/gis/gis_data.cf THE EXXON VALDEZ REOPENER: NATURAL RESOURCES DAMAGE SETTLEMENTS AND ROADS NOT TAKEN http://www.law.duke.edu/shell/cite.pl?2 http://wilco278.wordpress.com/categ Alaska Geospatial Data Clearinghouse http://agdc.usgs.gov/ Mineral Resources On-Line Spatial Data http://tin.er.usgs.gov/ http://www.dec.state.ak.us/spar/ip Department of Natural Resources http://dnr.alaska.gov/ Department Oil & Gas http://www.dog.dnr.state.ak.us/oil/ - - - - - - - - - - - - Government of Yukon » Departments » Energy, Mines, and Resources http://www.emr.gov.yk.ca/ |
| Thursday, August 19th, 2010 | |
| 10:10 am | Нефтяные компании, Канада: Husky Energy Husky Energy (русск. Ха́ски Э́нерджи) — одно из крупнейших канадских предприятий по производству углеводородов. Его разведанные запасы составляют 430 миллионов баррелей нефти. Оно владеет более чем 500 заправочными станциями в Канаде и насчитывает примерно 3000 служащих. По 35 % акций компании принадлежит китайскому миллиардеру Ли Кашину и его предприятию Hutchison Whampoa. http://ru.wikipedia.org/wiki/Husky_Ener The company employs approximately 4100 people (as of 2007), has almost $21 billion in assets, and produces an average of 385,000 barrels (61,200 m3) of oil equivalent per day (projected average low end for 2008) Founded 1938 as Husky Refining Company Revenue $12.664 billion [Cdn] - (2006) Husky Energy has proven petroleum reserves of 430 million barrels (68,000,000 m3) and 2 trillion cubic feet (57 km3) of natural gas, most of it in Western Canada. It owns approximately 500 filling stations in Canada http://en.wikipedia.org/wiki/Husky_Ener Annual Reports & Filings http://www.huskyenergy.com/investorrela Areas of Operations  http://www.huskyenergy.com/operations/ Также о компании http://www.wikinvest.com/stock/Husky_En |
| Monday, May 31st, 2010 | |
| 11:00 am | |
| Friday, May 28th, 2010 | |
| 11:05 am | Major Coal Mines and Coal Fired Plants in North America  ( 2748×1958 ) http://www.infomine.com/maps/posters/no |
| Thursday, May 27th, 2010 | |
| 11:30 am | |
| Wednesday, May 5th, 2010 | |
| 12:05 pm | WWF: Oil and gas in the Arctic (Канада, США) Oil and gas in the Arctic  http://wwf.panda.org/what_we_do/where_w ( 1650×1275 ) |
| Friday, April 2nd, 2010 | |
| 1:06 am | Америка Северная, Канада, атлас геологический Geological Atlas of the Western Canada Sedimentary Basin http://www.ags.gov.ab.ca/publications/w |


