[Most Recent Entries] [Calendar View] [Friends]
Below are the 5 most recent journal entries recorded in
iv_g's LiveJournal:
| Sunday, September 12th, 2010 | |
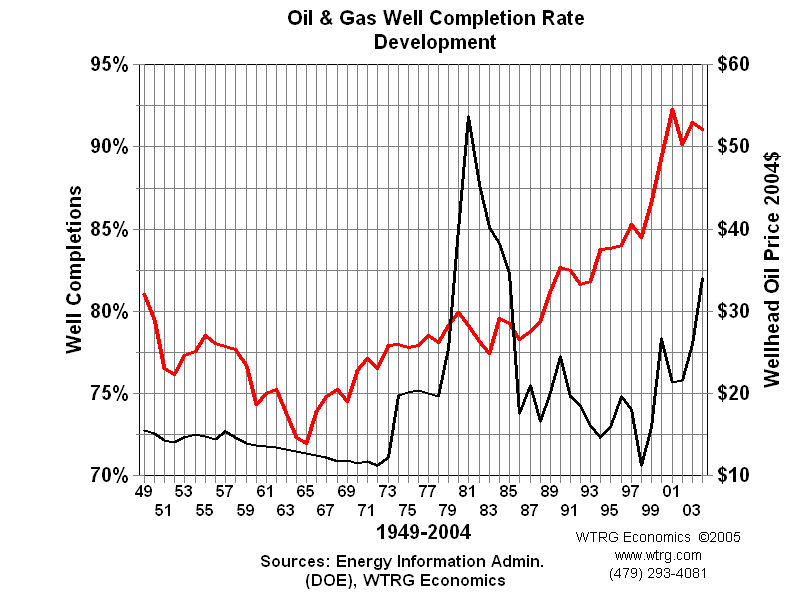
| 6:00 pm | PetroStrategies: нефтегазовые диаграммы This Week in Petroleum http://tonto.eia.doe.gov/oog/info/t Natural Gas Weekly Update http://tonto.eia.doe.gov/oog/info/ngw/n US Production http://tonto.eia.doe.gov/dnav/pet/pet_c 01  02 U.S. Crude Oil Wells and Prices  03 U.S. Natural Gas Wells and Prices  04 U.S. Natural Gas Future & Spot Prices  05 U.S. Natural Gas and Residual Fuel Oil Price Comparison  Fuel Oil Price Comparison - топочный мазут 06  07 U.S. Natural Gas Production  Natural Gas Gross Withdrawals and Production http://tonto.eia.doe.gov/dnav/ng/ng_pro 08 U.S. Natural Gas Supply and Demand  09  10  11  Crew Count - сейсмопартия 12 U.S. Drilling Success Rates  Natural Gas Prices http://tonto.eia.doe.gov/dnav/ng/ng_pri Domestic Crude Oil First Purchase Prices by Area http://tonto.eia.doe.gov/dnav/pet/pet_p Crude Oil and Natural Gas Drilling Activity http://tonto.eia.doe.gov/dnav/ng/ng_enr Cost of Crude Oil and Natural Gas Wells Drilled http://tonto.eia.doe.gov/dnav/pet/pet_c Crude Oil and Natural Gas Exploratory and Development Wells http://tonto.eia.doe.gov/dnav/pet/pet_c Источник http://www.petrostrategies.org/Graphs/g |
| Thursday, September 2nd, 2010 | |
| 1:20 pm | Global overview of offshore oil & gas operations for 2005-2009 in the last 10 years, more than half of new global oil and gas reserves were discovered offshore. Deepwater and ultra deepwater discoveries are becoming the dominant source of new reserve additions, accounting for 41% of total new reserves based on a statistical evaluation of discoveries between 2005 and 2009. In this paper, we used the following definitions: shallow water (SW) <= 400 m (1,312 ft), 400 m < deepwater (DW) <= 1,500 m (4,921 ft), and ultra deepwater (UDW) > 1,500 m; all related to bathymetric depth. Although the first offshore well may have occurred as early as the late 1890s, by and large, significant offshore activity was not forthcoming until after World War II. Despite limited technology and infrastructure, the first phase of offshore exploration continued from the 1940s to 1982. The year 1982, was a peak year for new field discoveries. In the 10 years prior to 1982, the number of offshore fields discovered per year more than doubled to 198. The second phase of offshore development may be viewed as the time period from 1983 to 2005. During this time, the number of new fields fluctuated dramatically from a low of 116 new offshore fields in the years 1993 and 1994, to the largest number of offshore fields discovered in the year 1990 (192 discoveries), never reaching the previous high noted in 1982. his span of time is notable for a large increase in inventory of offshore contract area as the number of countries offering acreage spiked from 95 in 1985 to 133 in the year 2005. There was an increase of valid contract area inventory from about 5.5 million sq km (2.1 million sq mi) in 1995 to 9.2 million sq km (3.6 million sq mi) in 2005. In 1985, the number of contracts for offshore acreage was about 2,300. In 2005, at the end of Phase Two, just over 12 years later, the number of contracts exceeded 8,500. Phase Three of offshore development represents an increase in offered acreage mainly due to the increase in new deepwater and ultra deepwater areas. At the start of 2010, valid contracted areas approached nearly 12 million sq km (4.6 million sq mi). In addition, more than 10,300 valid contracts for offshore acreage were in place at the start of 2010. While new deepwater production is masked by the greater volumes of new and ongoing shelf production, the balance is tilting towards the critical point where deepwater and ultra deepwater will dominate. This third phase of offshore exploration was ushered in during 2006, with the Tupi discovery in Brazil, which was a forerunner of a number of significant discoveries dominated by oil and liquids. deepwater (DW) and ultra deepwater (UDW) combined are becoming the predominant source of new oil and gas discoveries. From 2005 through 2009, giant and significant deepwater discoveries of oil and gas (41 Bboe, 2P reserves) were made in Brazil, the US, Angola, Australia, India, Nigeria, Ghana, and Malaysia. In fact, 2009 became a record year for UDW drilling, totaling 150 wells. On average, through 2005 and 2009, the drilled depth offshore increased from 3,100 m to 3,600 m (10,171 ft to 11,811 ft) and the average water depth from 450 m to 600 m (1,476 ft to 1,969 ft).       http://www.offshore-mag.com/index/artic |
| Tuesday, May 11th, 2010 | |
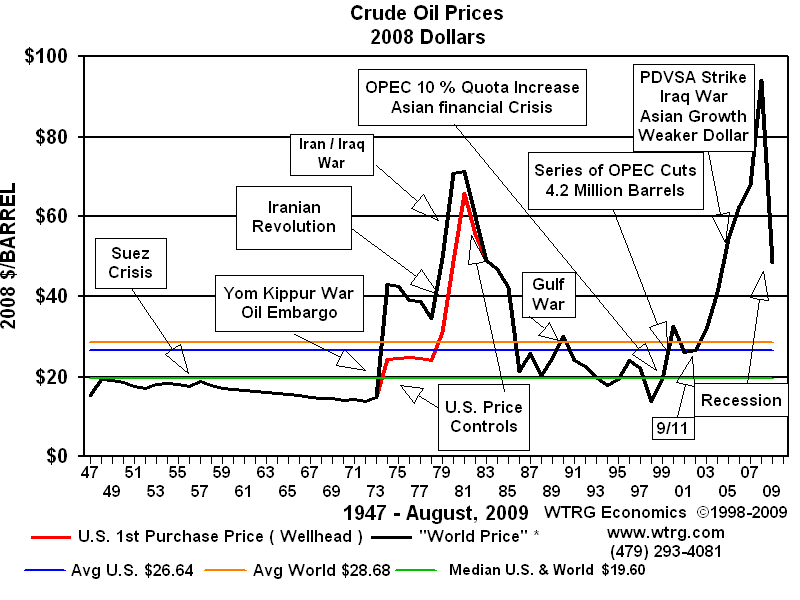
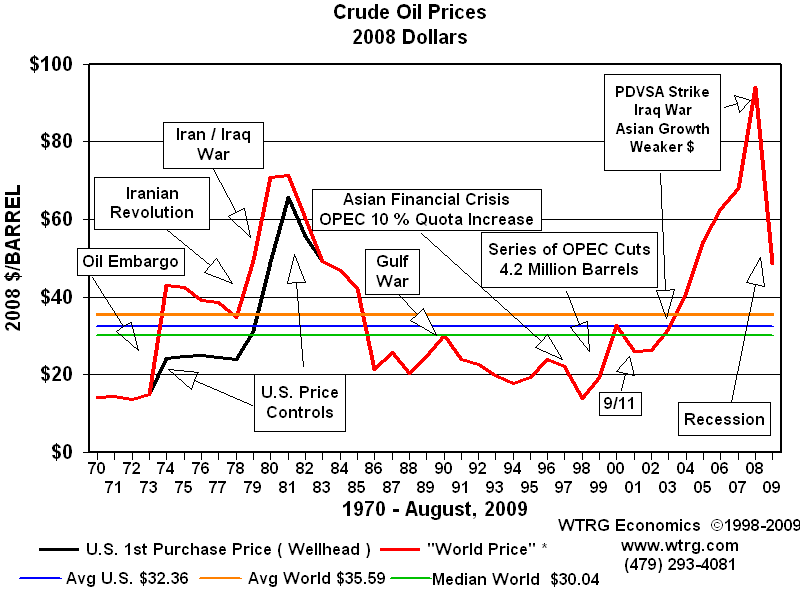
| 9:40 am | Цены на нефть - www.wtrg.com/prices.htm 1. Crude Oil Prices 1947 - August, 2009  2.  3.  4.  5.  6.  7.  8.  9.  10. US Oil Price Controls 1973-1981  11.  12. U.S. Petroleum Consumption  13.  14.  15.  16.  17.  18. World Events and Crude Oil Prices 2001-2007  19.  20. Excess Crude Oil Production Capacity  21.  22. U.S. Rotary Rig Count 1974-2005 Crude Oil and Natural Gas Drilling  23.  24.  25.  26.  27.  28.  29.  http://www.wtrg.com/prices.htm |
| Thursday, May 6th, 2010 | |
| 1:20 pm | |
| Tuesday, April 27th, 2010 | |
| 1:41 pm | Венесуэла, углеводороды Nov 27 2006 Venezuelan Oil Stats War http://www.energybulletin.net/node/2286    Quick Facts Energy Overview Proven Oil Reserves (January 1, 2010E) 99.4 billion barrels Oil Production (2008E) 2.64 million barrels per day Oil Consumption (2008E) 750 thousand barrels per day Crude Oil Distillation Capacity (2009E) 1.28 million barrels per day Proven Natural Gas Reserves (January 1, 2010E) 176 trillion cubic feet Natural Gas Production (2007E) 936 billion cubic feet Natural Gas Consumption (2007E) 936 billion cubic feet Recoverable Coal Reserves (2005E) 528 million short tons Coal Production (2007E) 9.25 million short tons Coal Consumption (2007E) 0.10 million short tons Electricity Installed Capacity (2007E) 22.5 gigawatts Electricity Generation (2007E) 118.1 billion kilowatt hours Electricity Consumption (2007E) 80.0 billion kilowatt hours Total Energy Consumption (2007E) 3.3 quadrillion Btus* 129 million Btus Energy Intensity (2007E) 10,608 Btu per $2005-PPP** http://www.eia.doe.gov/emeu/cabs/Venezu  http://agoracom.com/ir/Crystallex/forum   http://news.bbc.co.uk/2/shared/spl/hi/g    http://www.petroleumworld.com/sati09021 Статьи: May. 02, 2007 The End of Privatization for Venezuela's Oil http://www.energytribune.com/articles.c Venezuela News & Commentary - good analysis and in depth articles http://www.venezuelanalysis.com/ BoRev.net - Unmasking distorted media coverage of Venezuela http://www.borev.net/ Venezuela Information Office - Excellent source of background information http://www.rethinkvenezuela.com/index.h VHeadline - E-newspaper with extensive archives фhttp://web.onetel.com/~vheadline/emerg http://web.onetel.com/~vheadline/emerge |


