[Most Recent Entries] [Calendar View]
Tuesday, August 5th, 2014
| Time | Event |
| 1:18a | Microsoft Releases Windows Phone 8.1 Update Developer Preview
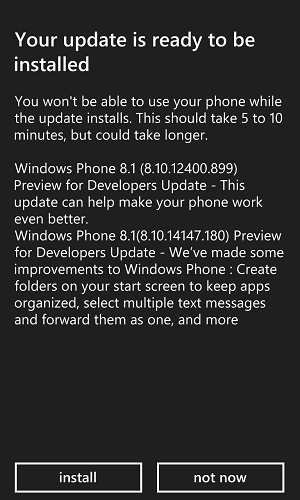
At roughly noon, Microsoft's Joe Belfiore (Vice President for Windows Phone) announced via Twitter that users enrolled in the developer preview should check for updates. Microsoft released the Windows Phone 8.1 Update (GDR1) to test, develop against, and enjoy.
If you're not familiar with the preview for developers program, this is Microsoft's way of circumventing the lengthy update roll-out process. Windows Phone vendors (Nokia, HTC, Samsung, etc) first integrate the update with their software stack, send it to regional operators (AT&T, Rogers, etc), and finally the regional operators test, validate and deploy it. Microsoft likely calls it a developer preview to appease these partners, but considering it cost $0 and takes three minutes to sign up, its true role is quite obvious and tech enthusiasts appreciate it. To briefly recap, Microsoft described that Windows Phone 8.1 GDR1 will contain localization and Bluetooth improvements to Cortana, text messaging, mobile IE, enterprise app settings, and a unique approach to folders. I was particularly curious how the 'live folders' worked. At first I wasn't sure it was working, as the folder doesn't immediately update its tile after creation and instead waits for the contained tiles to update. Therefore, it can take a moment before any movement is seen. I've personally grown used to not having folders, but this implementation which maintains the live updates is appreciated. I was also curious what user agent string the web browser uses now. Mozilla/5.0 (Mobile; Windows Phone 8.1; Android 4.0; ARM; Trident/7.0; Touch; rv:11.0; IEMobile/11.0; NOKIA; Lumia 920) like iPhone OS 7_0_3 Mac OS X AppleWebKit/537 (KHTML, like Gecko) Mobile Safari/537 It is pretty funny seeing iPhone, Android, OS X, WebKit, Apple, Nokie, IE, Trident, the kitchen sink, you-name-it, all in one user agent. Microsoft stated that IE mobile was consistently served non-mobile pages by major web sites like Google and Twitter, so changing the user agent to a mobile catch-all is certainly one way to resolve that. No software update or Microsoft blog post ever seems to include a complete change list, so there are some extra user-visible improvements found in the update that were unexpected. VPN support previously included SSL VPN and IKEv2, and now grows to include L2TP with IPSec. Cellular data tethering now works over Bluetooth as well as WiFi. Microsoft posted a Windows Phone 8.1 GDR1 change list for OEMs that gives some insight into behind the scenes changes. Larger screen sizes (up to monster 7" devices) are now supported, along with a variety of new mid-tier resolutions. Microsoft added several Bluetooth improvements including higher fidelity audio and network audio video browsing through AVRCP. Dual SIM now supports C + G (CDMA + GSM). Finally, phone cover apps have new settings, although no interactive phone covers exist yet.
|
| 8:00a | Galaxy S5 LTE-A: Battery Life, Performance
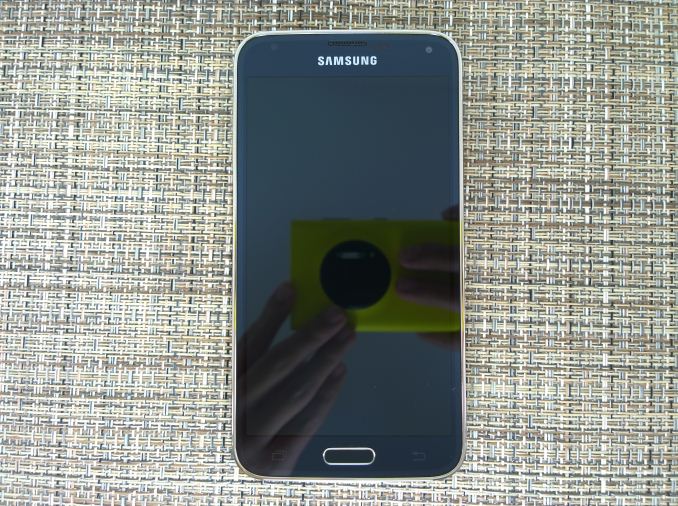
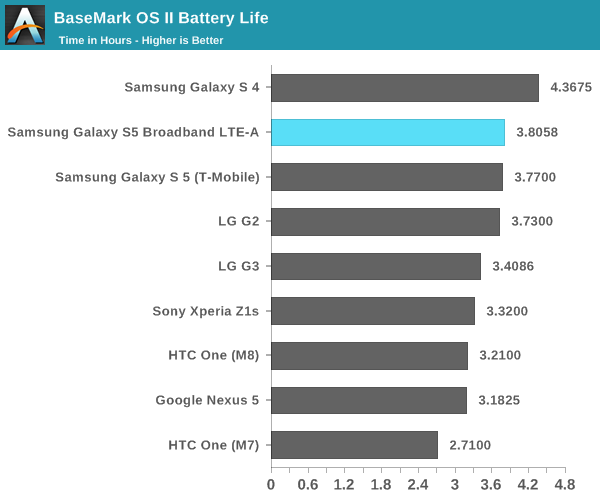
While I was planning on doing a full review for the GS5 LTE-A, it turns out that there’s relatively little that changes between the original Galaxy S5 and this Snapdragon 805 version. For those that aren’t quite familiar with this variant of the Galaxy S5, most of the device stays the same in terms of design, battery size, waterproofing, UI, and camera. What does change are the SoC, modem, and display. The SoC is largely similar to the one we see in the original Galaxy S5, but a minor update to CPU (Krait 450 vs Krait 400), more memory bandwidth, faster GPU, and faster ISP. In addition, the modem goes from category 4 LTE support on a 28HPm process to category 6 LTE support on TSMC’s 20nm SoC process. What this means is that the maximum data rate goes from 150 Mbps to 300 Mbps. Finally, the display goes from 1080p to 1440p in resolution, and we've previously covered the display's surprisingly good calibration and general characteristics. Battery LifeOf course, one of the major questions has been whether battery life has been compromised by the higher resolution display or more powerful GPU. To answer these questions, we turn to our standard suite of tests, which include web browsing battery life and battery life under intensive load. In all cases where the test has the display on, the display is calibrated to 200 nits.
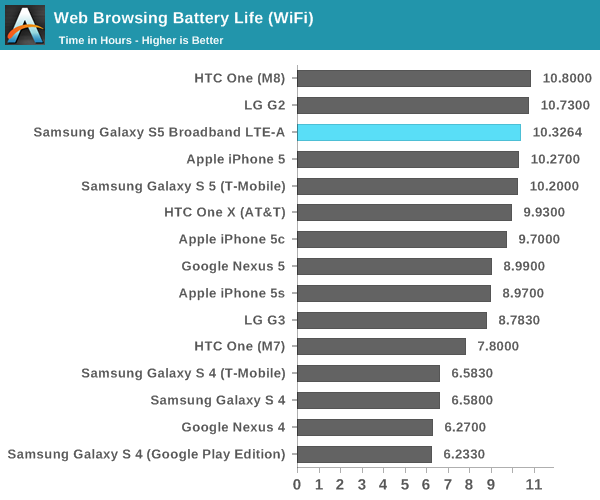
In this test, we see that the GS5 LTE-A is ever so slightly better than the Galaxy S5 in WiFi web browsing, which is quite a stunning result. However, the result is within the margin of error for this test, which is no more than 1-2%. This result is quite surprising, especially because we saw how the move to QHD significantly reduced battery life on the LG G3 compared to the competition. Samsung states that there is an improved emitter material in the OLED display, which is probably responsible for the relatively low impact of the QHD display. This kind of power efficiency improvement is due to the relatively immature state of OLED emitter material technology when compared to LED backlight technology. The other area where power improvements could come from is the WiFi chip itself. Instead of Broadcom's BCM4354, we see a Qualcomm Atheros QCA6174 solution in this variant. Both support 2x2 802.11ac WiFi for a maximum throughput of 866 Mbps, but there's a possibility that the QCA6174 solution is more power efficient than the BCM4354 we found in the original Galaxy S5.
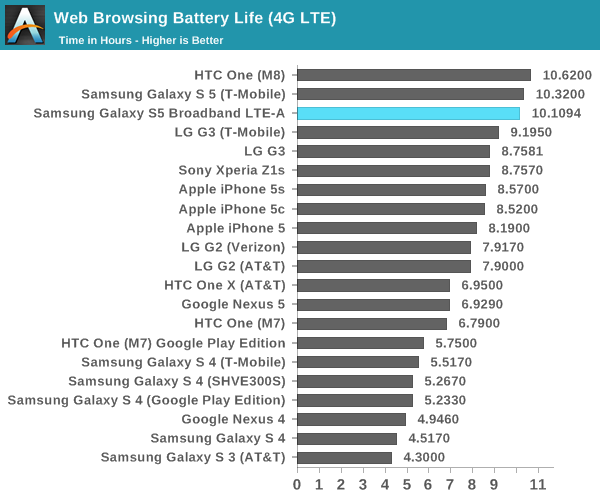
In the LTE web browsing test, we see a similar story as once again the Galaxy S5 LTE-A is within the margin of error for our test. As mentioned before, improvements to the display could reduce the effect that higher DPI has on power consumption. The other element here that could reduce power consumption would be the MDM9x35 modem, which is built on a 20nm SoC process for lower power consumption.
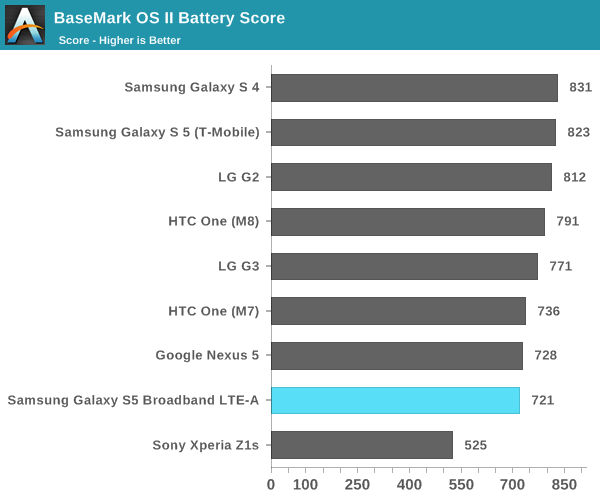
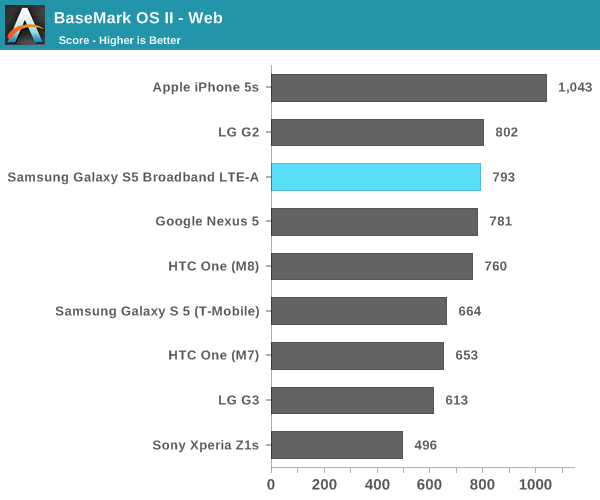
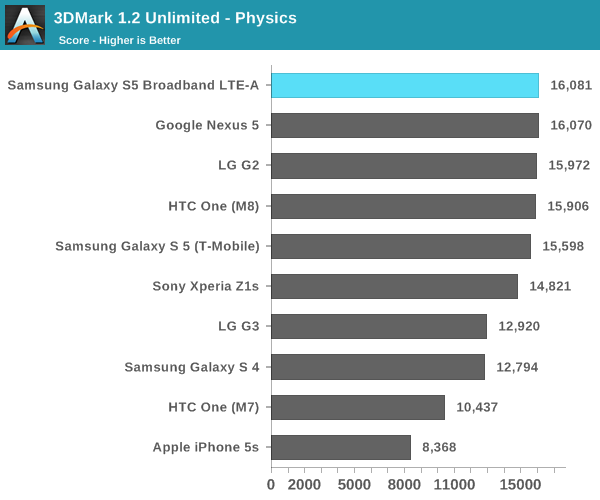
In order to better show the effects of stressing the CPU, GPU, NAND, and RAM subsystems we turn to our compute-intensive tests. For Basemark OS II, once again we see that battery life on the Galaxy S5 LTE-A is effectively identical to the original Galaxy S5. However, it seems that this comes at the cost of worse performance, which is likely the result of running at a higher resolution and higher ambient temperatures.
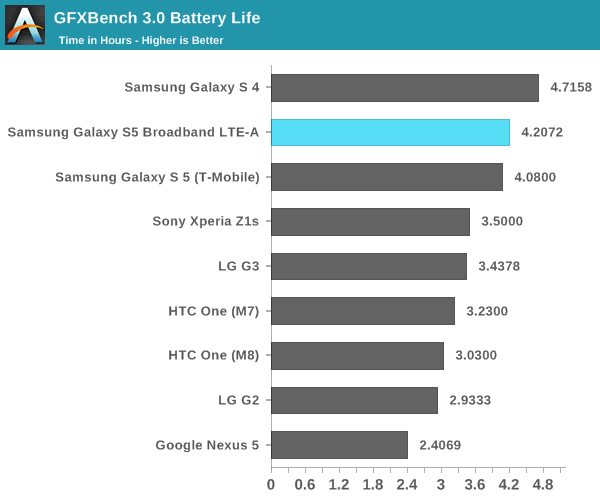
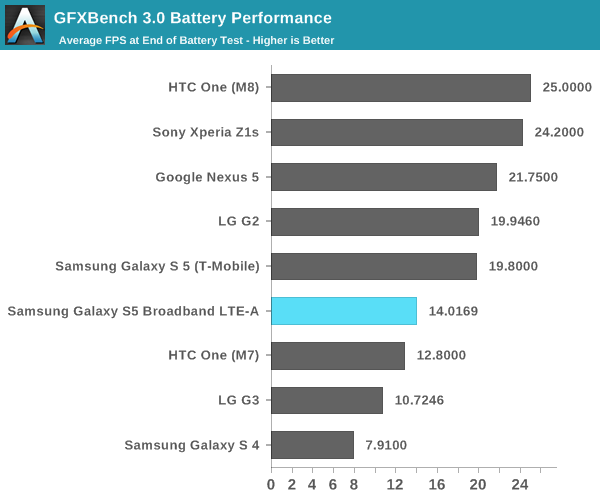
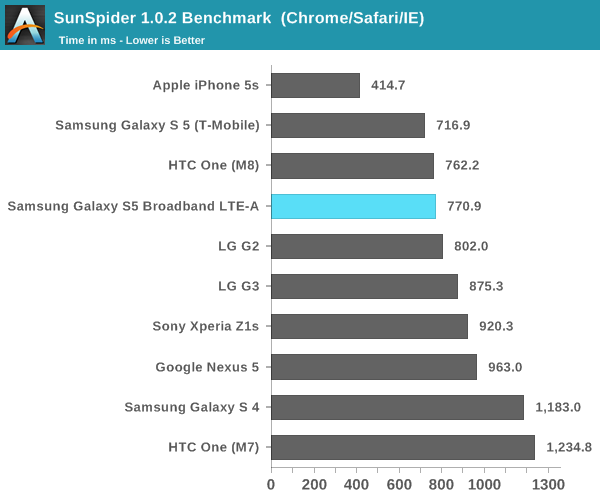
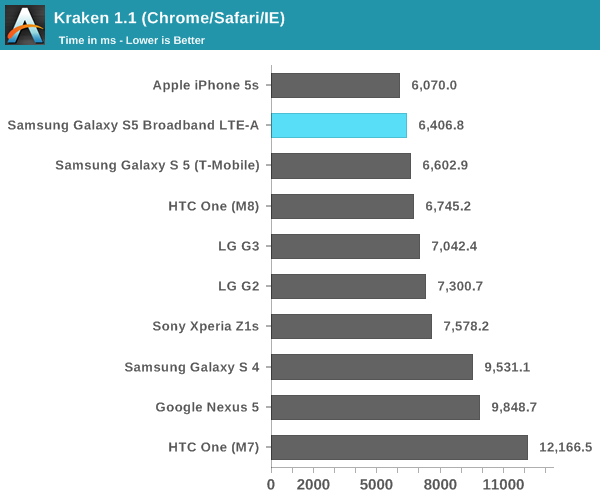
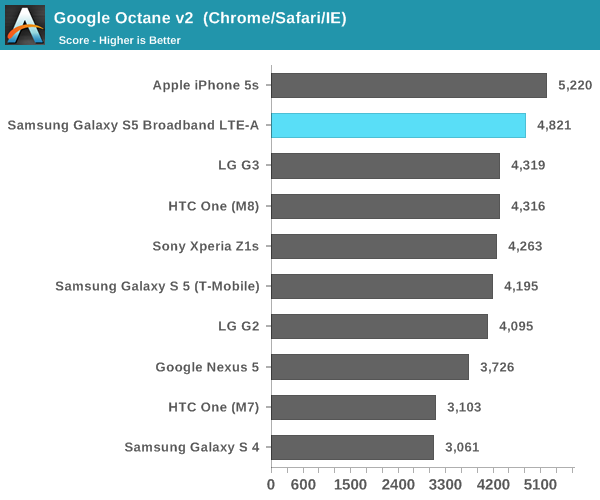
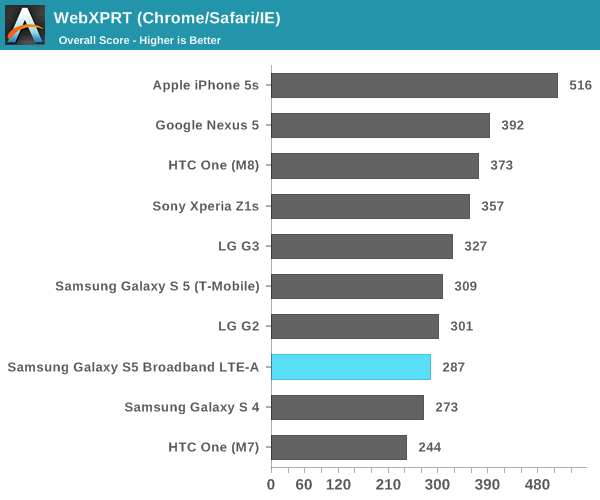
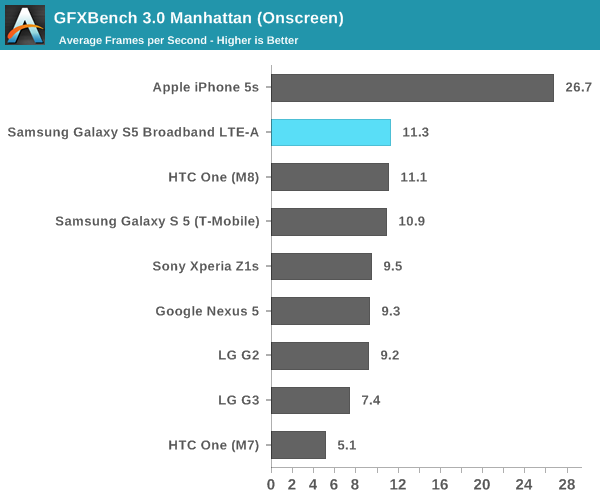
While Basemark OS II seems to mostly simulate intensive conventional usage of a smartphone, GFXBench is a reasonably close approximation of intensive 3D gaming. Surprisingly, we see here that the GS5 LTE-A is ahead of the GS5. It seems that the GPU architecture of the Adreno 420 is more efficient than what we saw in the Adreno 330. Once we scale the final FPS by resolution, we see that the end of run performance is around 22 FPS, which means that performance ends up being a bit higher than the original Galaxy S5. This seems to suggest a more efficient GPU architecture. CPU PerformanceWhile sustained performance is important, more often than not mobile use cases end up being quite bursty in nature. After all, a phone that lasts "all day" usually only has its screen on for 4-6 hours of a 16 hour day. To get a better idea of performance in these situations, we turn to our more conventional benchmarks. For the most part, I wouldn't expect much improvement here. While it's true that we're looking a new revision of Krait, it seems to be mostly bugfixes and various other small tweaks, not any significant IPC increase.
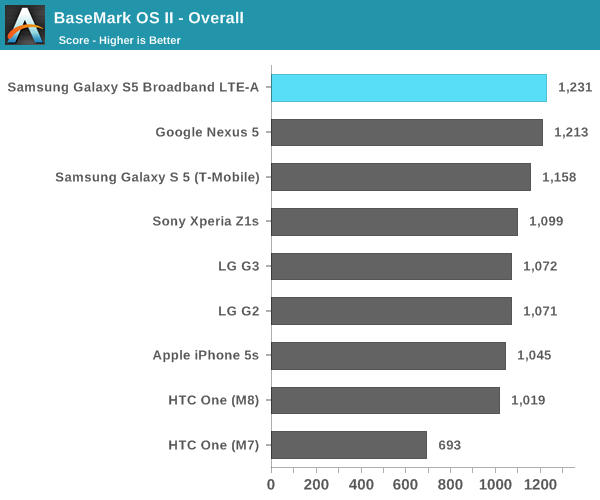
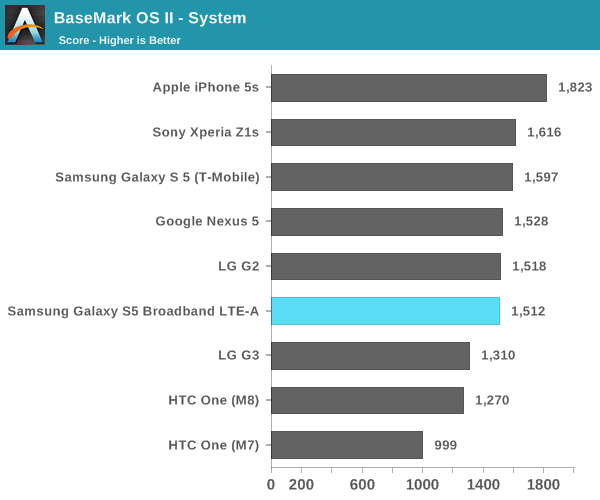
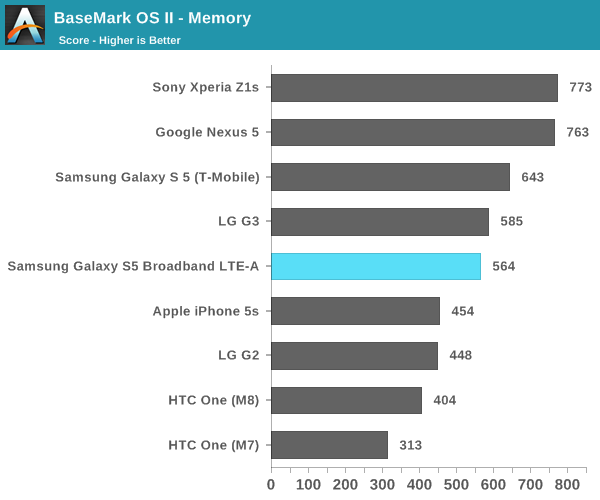
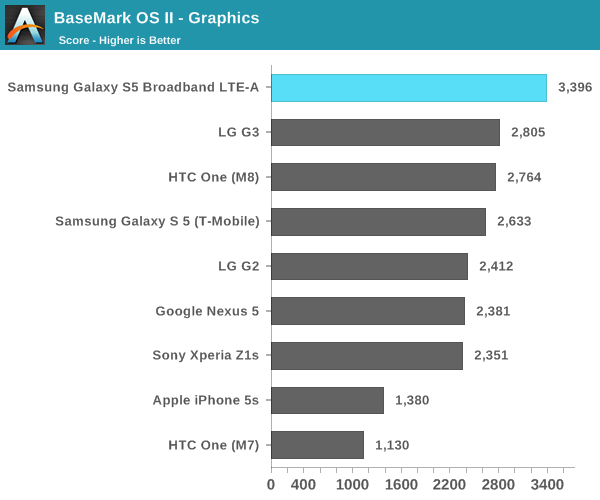
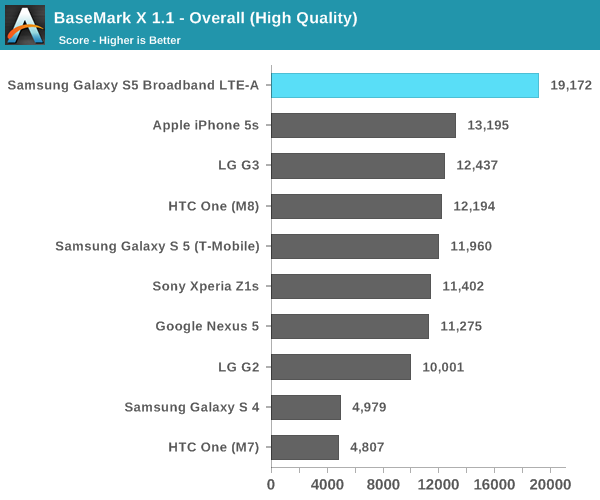
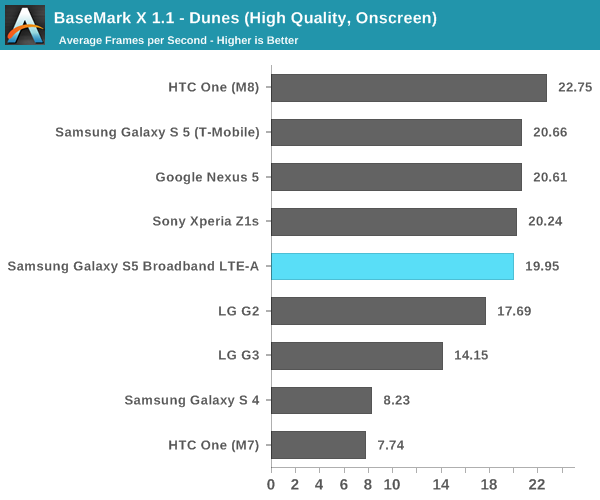
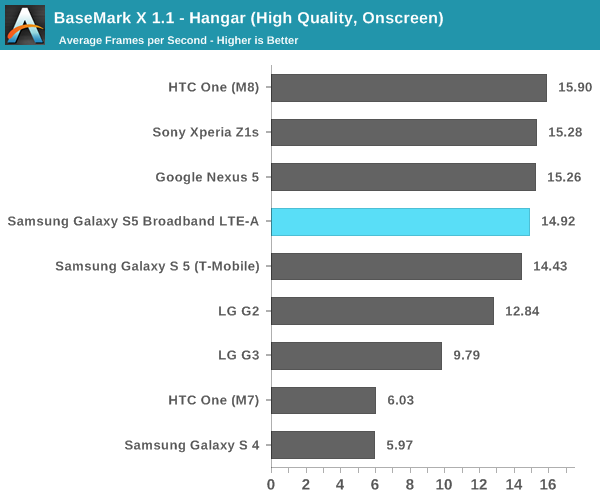
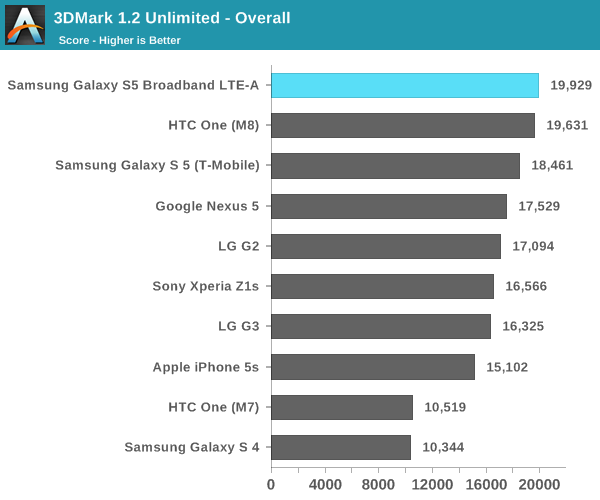
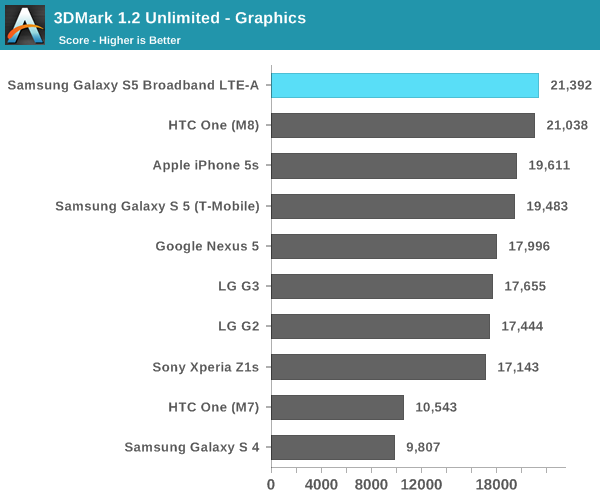
As seen in the CPU-bound tests, the GS5 LTE-A tends to trade blows with other Snapdragon 801 devices. The only real area where we can see a noticeable lead is the graphics test in Basemark OS II, which gives us a good idea of what to expect for the GPU-bound tests. GPU BenchmarksIf there's any one improvement that matters the most with Snapdragon 805, it's in graphics. While there is a minor clock bump from 578 MHz to 600 MHz in the Adreno 420, this accounts only accounts for a 3.9% bump in performance if performance per clock is identical when comparing the Adreno 330 and Adreno 420. For those unfamiliar with the Adreno 420, this is a new GPU architecture that brings Open GL ES 3.1 support, along with support for ASTC texture compression and tesselation. As a result, the Adreno 420 should be able to support much better graphics in video games and similar workloads, along with better performance overall when supporting a higher 1440p resolution display when compared to Adreno 330. While we saw how Adreno 420 performed in Qualcomm's developer tablet, this is the first shipping implementation of Adreno 420 so it's well worth another look.
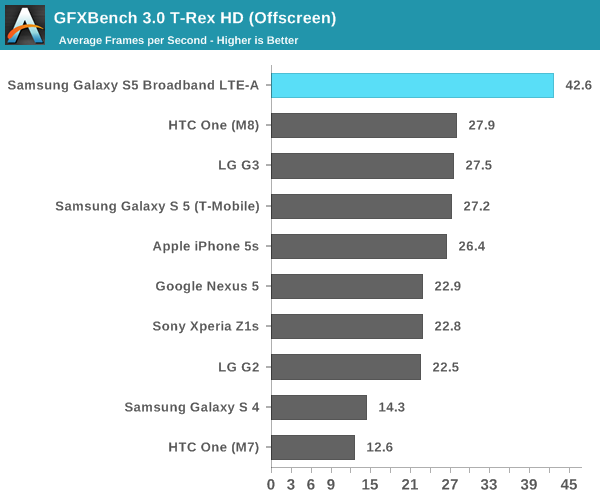
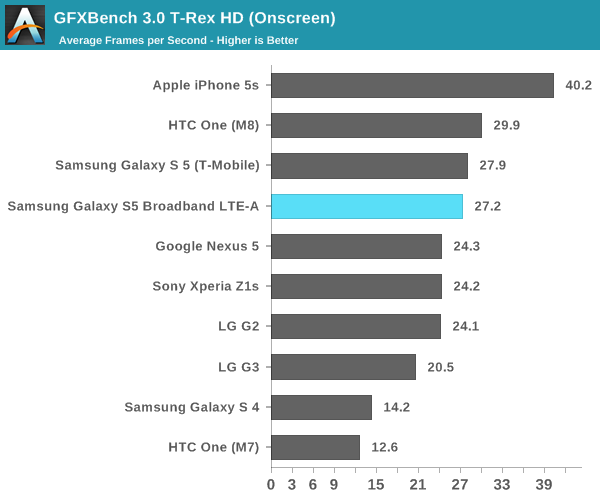
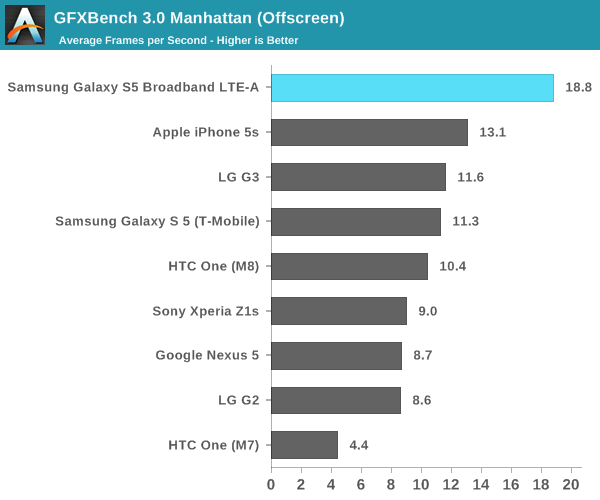
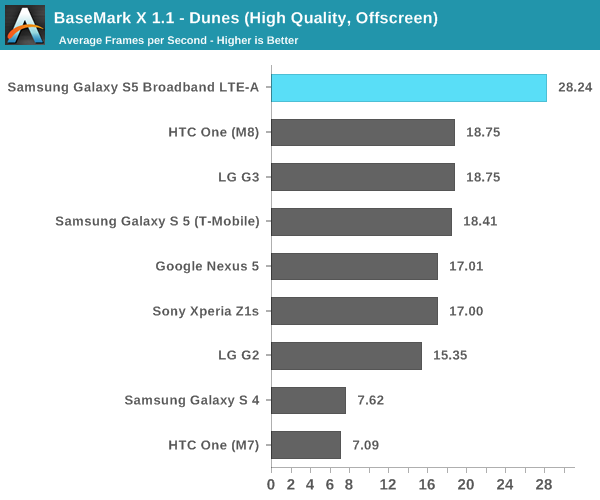
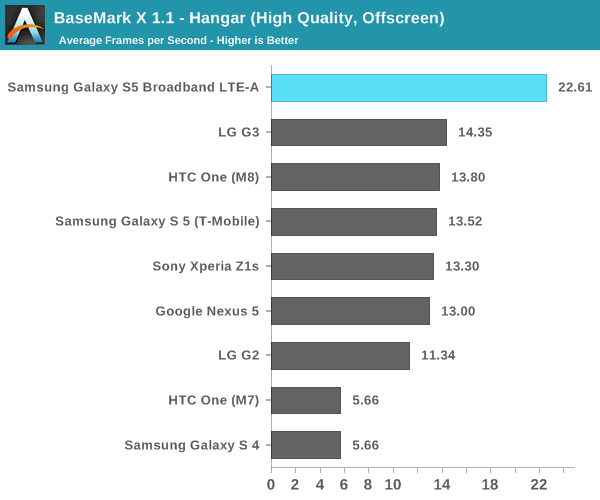
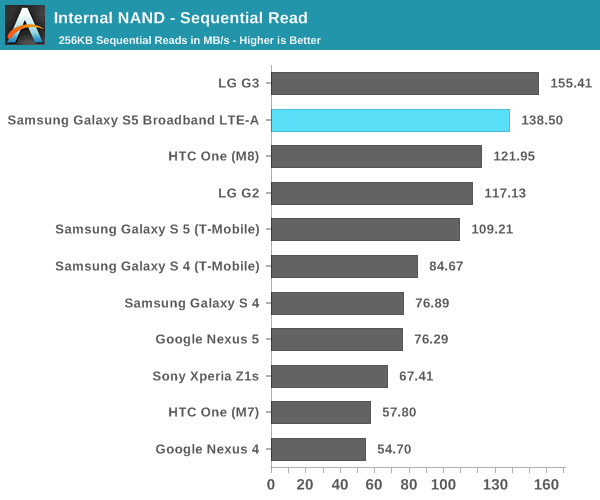
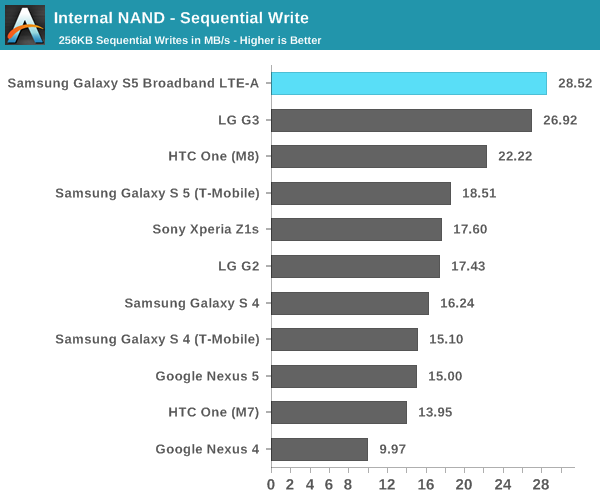
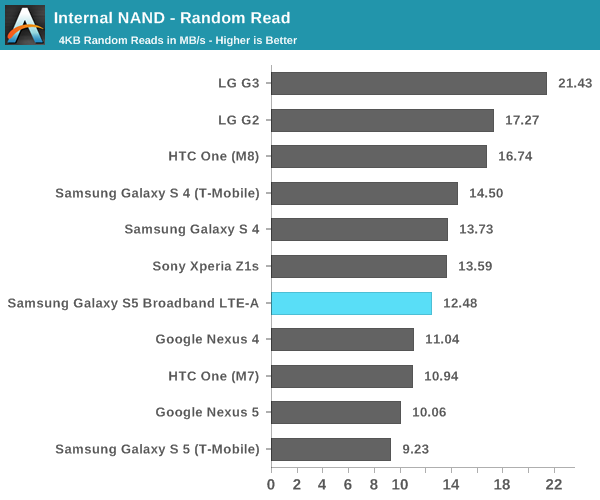
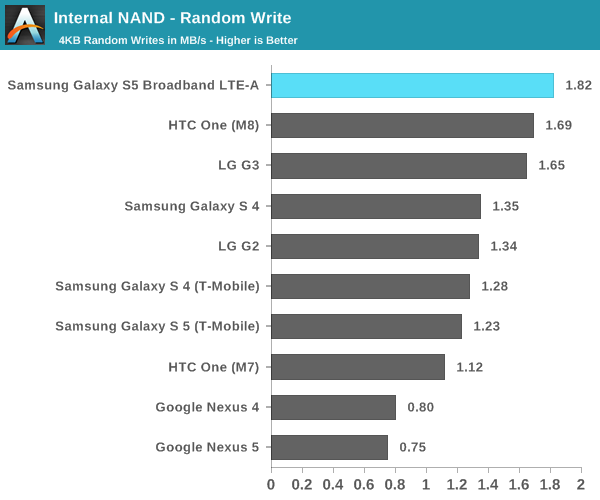
Here, we see a general trend that in the off-screen benchmarks, the Adreno 420 has a solid lead over other smartphones. Against the Adreno 330, we see around a 50-60% performance increase. However, in the on-screen benchmarks the GS5 LTE-A is solidly middle of the pack. It seems that we will have to wait until Adreno 430 and Snapdragon 810 to see on-screen GPU performance improve if the display has a 1440p resolution. NAND PerformanceSince we're still on the subject of the GS5 LTE-A's performance, I wanted to make a note of something else that changed. It seems that Samsung has put higher performance NAND into this device as well, as there's a noticeable uplift in read and write speed, regardless of whether it's sequential or random.
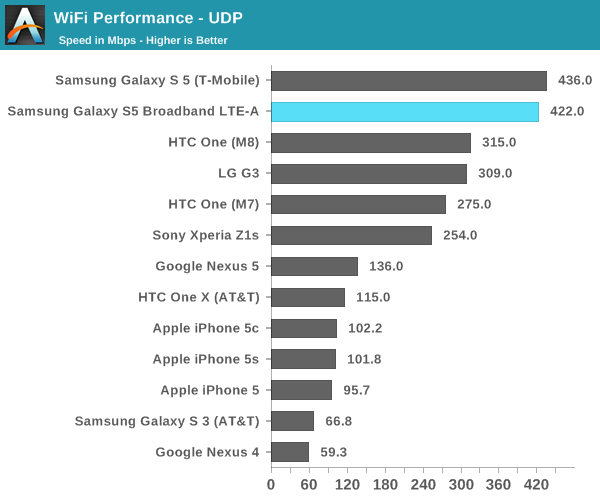
WiFi PerformanceWhile at first I thought that the GS5 LTE-A would use the Broadcom BCM4354 chipset for 2x2 802.11ac WiFi, it turns out that this wasn't the case at all. As I mentioned earlier, this is the first shipping implementation of Qualcomm Atheros' QCA6174 WiFi chip. To see whether it's any faster, I used iperf and an Asus RT-AC68U router to try and see what peak UDP throughput is like.
As we can see here, it's effectively neck and neck and quite hard to tell the two apart. Both Galaxy S5s are far ahead of their single stream competition, but we see that two spatial streams only delivers around a 36% increase in performance. Final WordsWhile there's been a lot of discussion over the impact of 1440p displays on battery life and performance, it seems that Samsung has managed to make the move to 1440p without losing performance or battery life for the most part. Of course, there's always the question of how much better battery life could be by utilizing the same technologies for a 1080p panel. This ends up going back to the question of whether it's possible to notice the higher resolution. To some extent, the answer is yes, and it becomes much more noticeable when used for VR purposes. However, in normal usage it's not immediately noticeable unless one has good or even great vision. Outside of conventional battery life and performance tests, there are still a few more things to cover. I've noticed that there's a new Sony IMX240 camera sensor in the GS5 LTE-A, and I've been working on a more in-depth look at the MDM9x35 modem. Overall, we can see that this is a relatively straight upgrade of the original Galaxy S5. This will also give us a good idea of what to expect for future high-end Samsung devices launching in the next few months. |
| 11:20a | Microsoft's Surface Pro 3: Core i3 vs. Core i5 Battery Life
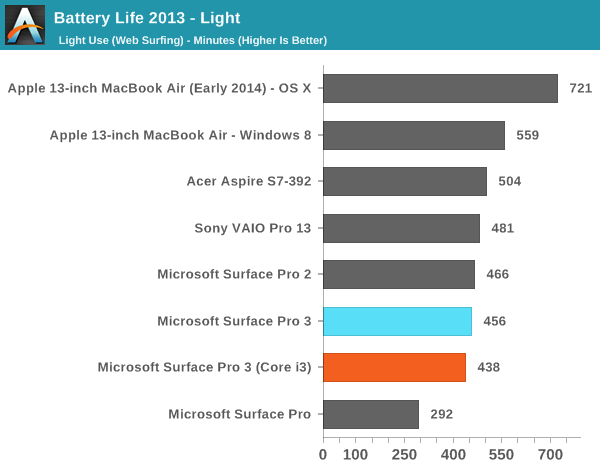
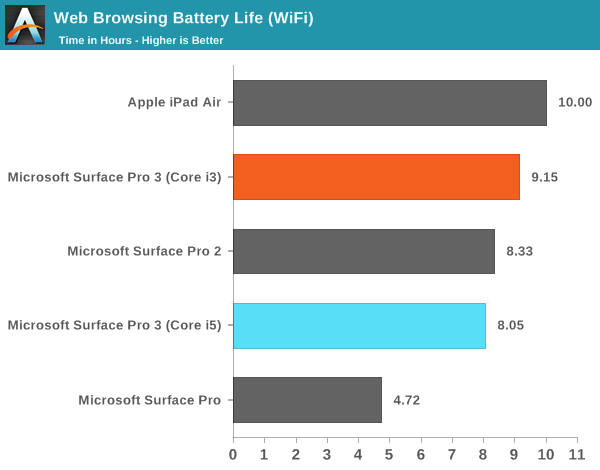
A couple of weeks ago I offered a brief performance preview of the $799 entry level Surface Pro 3 with an Intel Core i3-4020Y. The performance hit in going down to the $799 model is significant but compared to an upgraded ARM tablet you do get substantially more functionality/performance. The big unknown at the time was battery life. Going down to a Y-series part comes with a reduction in TDP (15W down to 11.5W), which could have power implications. I spent the past week running and re-running battery life tests on the Core i3 model of the Surface Pro 3. For the most part, battery life hasn't changed. As you'll see from our laptop results, the Core i3 Surface Pro 3's battery life shows a slight regression compared to our Core i5 results but not significantly so:
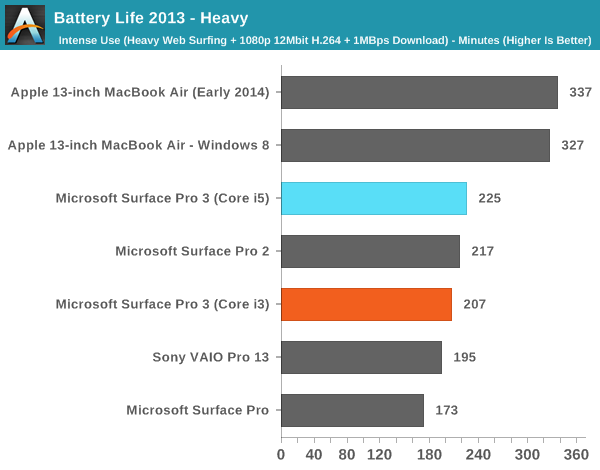
Although our laptop tests didn't show any gains, our tablet workload showed a substantial increase in battery life for the Core i3 version vs. the Core i5 Surface Pro 3:
An 11% increase in battery life is likely due to the lower power binned Y-series Haswell ULx part. It's interesting to me that the gains are exclusively in our lightest workload and don't appear to be present under any of the more active workloads. The decrease in TDP would imply a reduction in peak active power consumption but perhaps that's more a function of the reduced clocks. What we see at lighter/more idle workloads is a reduction in leakage thanks to the Y-series part. I still feel like the best overall balance of battery life, storage, performance and price is going to be a Surface Pro 3 equipped with a Core i5. I think where the $799 Core i3 makes sense is if you're budget limited and left with the choice between a 64GB ARM based tablet or the entry level Surface Pro 3. The problem is typically users who stretch their budget to get a 64GB ARM based tablet want the storage space, which is something you sacrifice when you move to a 64GB Windows 8.1 device (roughly 21GB free on a new install). I don't see the $799 Surface Pro 3 necessarily catering to the same market as a high end ARM device, but I think the entry level SP3 does embody Microsoft's mission better than any of the more expensive configurations. There's very little cross shopping between a $499 ARM based tablet and a $1200+ Surface Pro 3, but the entry level SP3 can serve as an in-between device if you want some of both worlds. |
| 1:00p | Pebble Unveils Limited Edition Smartwatch Colors
The Pebble smartwatch has been around for quite a long time compared to the wearables put forth by other manufacturers. It was one of the earliest devices in the smartwatch category. However, that isn’t to say that the Pebble has remained the same since it first came out. The Pebble app store is now home to over 1000 applications, and the original design was improved with the Pebble Steel earlier this year at CES. The original Pebble watch is still available for purchase though, and today a new trio of limited edition Pebble watches in new colors are being put up for purchase on the Pebble website. Pebble is naming these new color schemes Fresh, Hot, and Fly for the green, pink, and blue options respectively. In addition to the new color schemes, Pebble is shipping some new watchfaces to match each new watch. A new application from The Weather Channel is also being added to the Pebble app store. Both of these are available now to all Pebble users. As stated above, this is a one-time production run of these limited edition colors for the Pebble smartwatch. All three new models are available now on the Pebble website for $150 while supplies last.
|
| 8:55p | State of the Part: CPUs
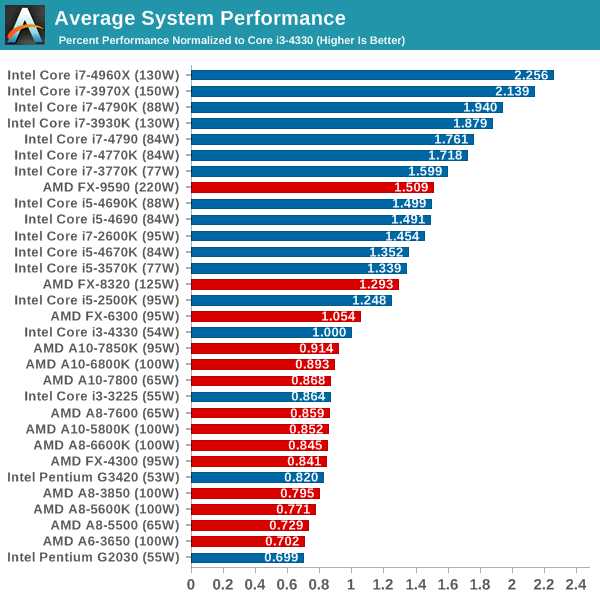
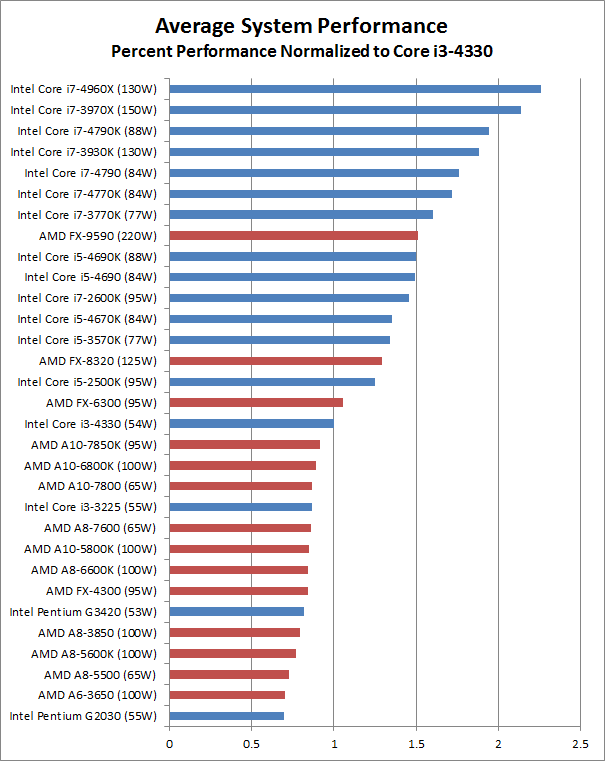
Short Introduction to CPUs and TerminologyThere are many elements that go into any modern computer: the CPU/APU, motherboard, memory, (optional) GPU, storage, case, and power supply. While some items like the case and power supply don't usually have an impact on performance, the CPU is one of the core elements and should be carefully selected. The goal today is to give a short overview of the level of performance you can expect across a large selection of CPUs/APUs. Of course the choice of CPU also limits your choice of motherboard and potentially other components, but that's a topic for another day. Briefly, both AMD and Intel have several current platforms, and each CPU/APU requires a specific class of platform (i.e. a certain CPU/APU socket). AMD currently has the FM2/FM2+ platforms for APUs, with the AM3+ platform being used for CPUs (though AM3+ is mostly being phased out at this stage); Intel has platforms for sockets LGA1150 and LGA2011, with the latter being a higher performance/higher cost "Extreme" platform that borrows quite a bit from Intel's workstation platform (and LGA2011 is set to be replaced by a new platform next month). Before we go any further, let's take a step back and quickly cover some of the terms we'll be throwing around. CPU stands for Central Processing Unit, and broadly speaking it handles most of the calculations that a modern PC performs in order to do useful work. APU stands for Accelerated Processing Unit, and it's AMD's marketing term for a CPU that also includes a GPU (Graphics Processing Unit), with the distinction being that the GPU portion must be able to perform at a minimum a certain subset of calculations. AMD's APUs all have at least DirectX 11 capabilities, and while Intel now includes DX11 GPUs (called "processor graphics") in most of their CPUs, in general AMD's APUs have faster/better graphics than Intel's CPUs. Then we come to the processor model numbers. It would be great if higher numbers were universally better, but these days all CPUs/APUs use model numbers that are similar to what you'll find with many other products (e.g. cars). A higher number can mean many things – better performance, more features, lower power, a newer part, etc. – and both AMD and Intel have several families of processors. There are also differences between generations of processors that can have an impact on performance and features, but again this is a topic to address in greater detail elsewhere. The short summary is that on the Intel side, in order of increasing performance/features the processor families include the Celeron, Pentium, Core i3, Core i5, and Core i7. For AMD, things are a bit easier as their processor models consist of the A4, A6, A8, and A10 APUs, along with FX-series CPUs (i.e. no graphics, though AMD is releasing mobile FX-series APUs now in the laptop market). If you want to know more about the features and specifications of any particular processor, you can use Intel's ARK or AMD's desktop APUs and desktop CPUs. Comparison of CPU and Graphics PerformanceWith that introduction out of the way, let's move on to the level of performance you can expect. All of the performance information presented here comes from CPU Bench, but instead of looking at individual charts we have averaged performance across a bunch of tests and normalized the scores relative to Intel's Core i3-4330. Note that not all benchmarks were tested on every processor, but we selected those tests that were run on most configurations; the charts below thus represent a high level overview of CPU performance, and we have also tested the integrated graphics performance where applicable, again normalized relative to i3-4330 performance.
There's a lot of abstraction going on here, naturally, so if you want specifics on benchmark results you'll need to refer to CPU Bench. The benchmarks used include single-threaded and multi-threaded workloads, along with system tests that will hit storage and memory quite a bit (e.g. PCMark 8 and 7-zip); the graphics benchmarks use five games along with two GPU compute tests. While the i7-4960X may not win every benchmark, and likewise the Pentium G2030 may not lose every benchmark, looking at overall relative performance gives us the above results and provides a good baseline recommendation as to which CPUs are the fastest.
The above graphs are a great picture of the split happening in the world of CPUs/APUs. On the CPU side of the fence, Intel is virtually untouched by AMD. Our reference i3-4330 is faster than all but the fastest AMD processors, and in fact only the AMD CPUs (i.e. not APUs) are able to surpass the overall performance of Intel's i3-4330. Of course we also have to look at what the overall scores really mean, and while the fastest CPUs like the i7-4960X are more than twice as fast as the i3-4330, the slowest CPU included in the charts – the Pentium G2030 – still provides 70% of the performance of the i3-4330. For general use cases like surfing the Internet and watching movies, all of the processors in the above chart should suffice, and other elements like storage often have a bigger impact on the user experience.
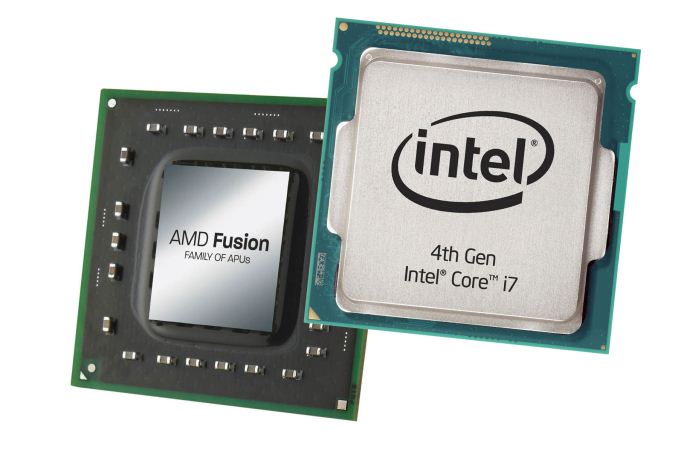
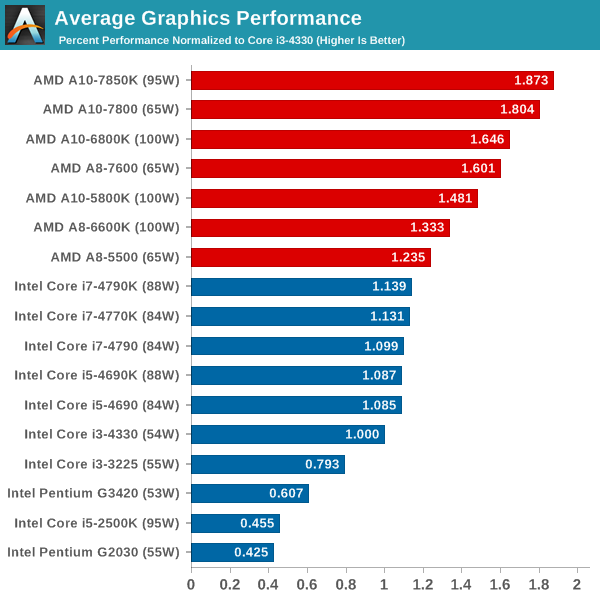
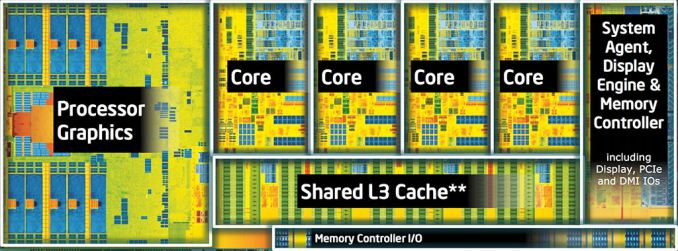
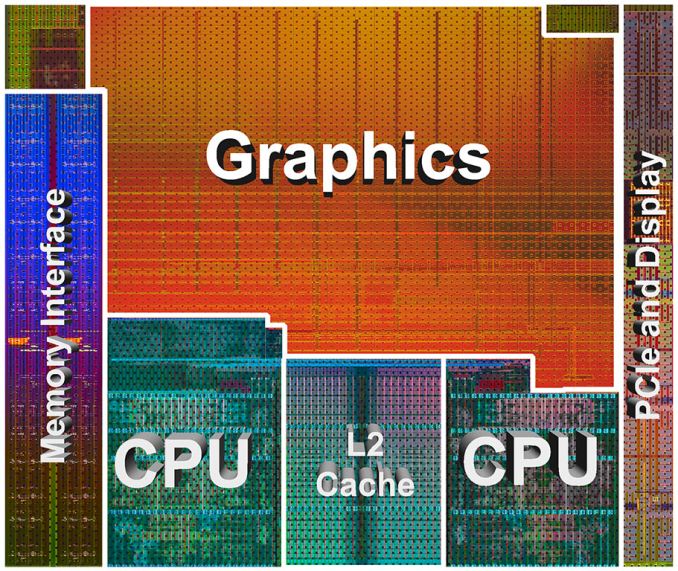
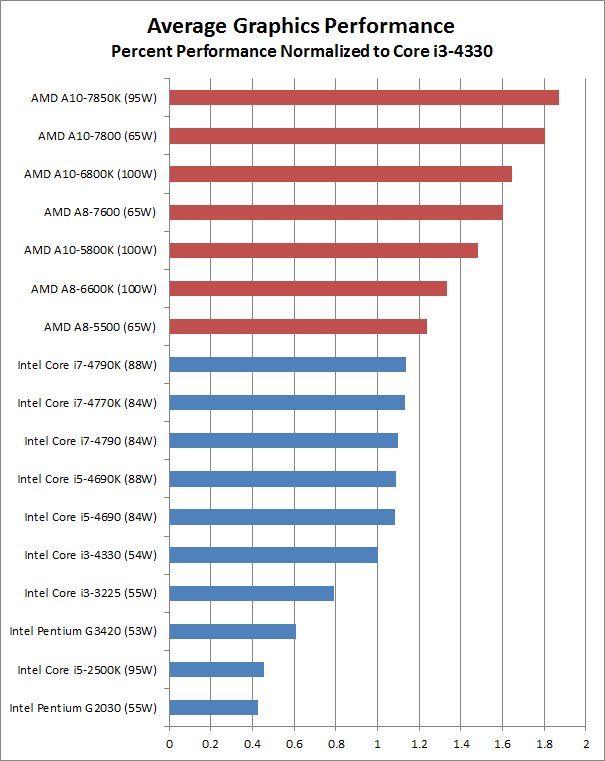
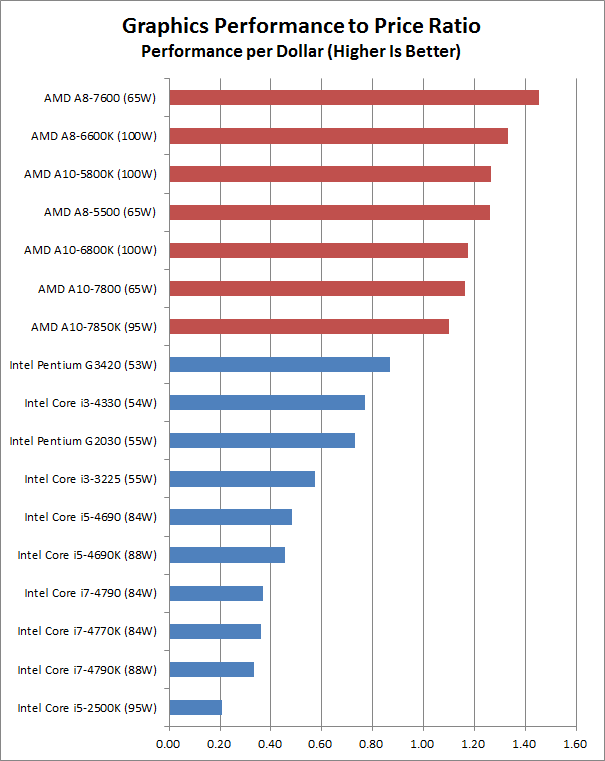
Moving to the graphics chart, the tables are turned and even Intel's fastest graphics solutions (outside of the HD 5000, Iris, and Iris Pro, which we have not includes as they're limited to laptops and OEM systems) are still slower overall than the AMD A8-5500. You can see from the above two die shots that AMD has dedicated a proportionally larger amount of the chip to graphics than Intel has, though Intel's Haswell GT3 parts double the graphics portion and end up being closer to AMD in terms of alloted space, while AMD disables portions of the graphics on their A8 and A6 APUs. We're missing results from many older/slower processors of course, and adding in even a budget dedicated GPU (i.e. the AMD R7 240 or NVIDIA GT 730) would in most cases deliver better overall performance than even the fastest on-die GPU. While graphics has become more important over time, in practice it's mostly useful for gaming and a few computationally intensive workloads like video and image processing. That could change and GPU performance could become a bigger element of the overall user experience, and that's where AMD is trying to go with their talk about Compute Cores, but currently GPU performance isn't as useful as CPU performance for most tasks. Performance to Price Ratios
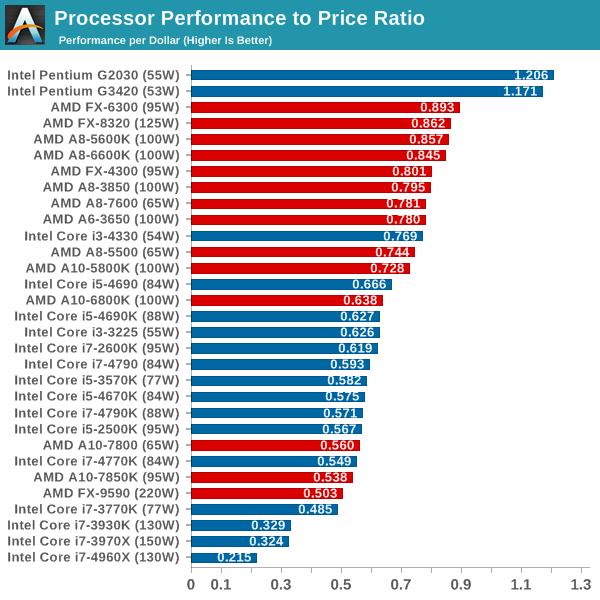
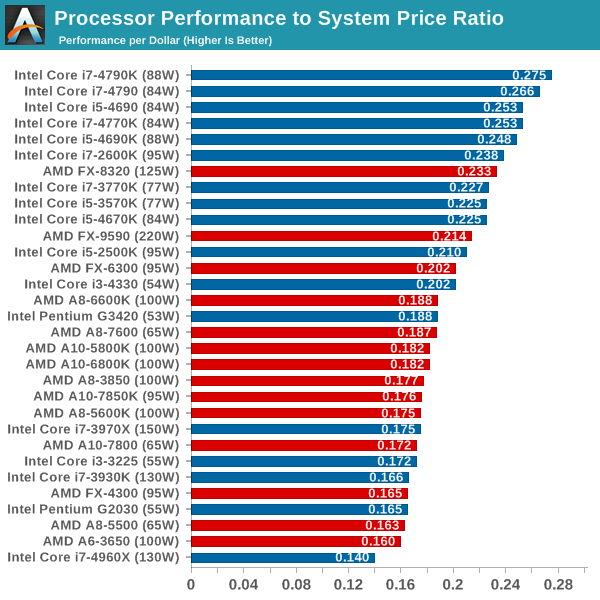
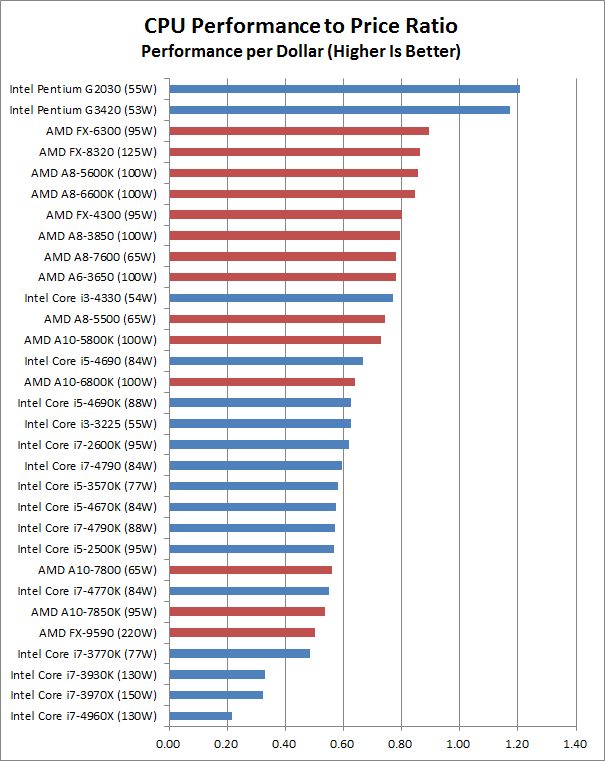
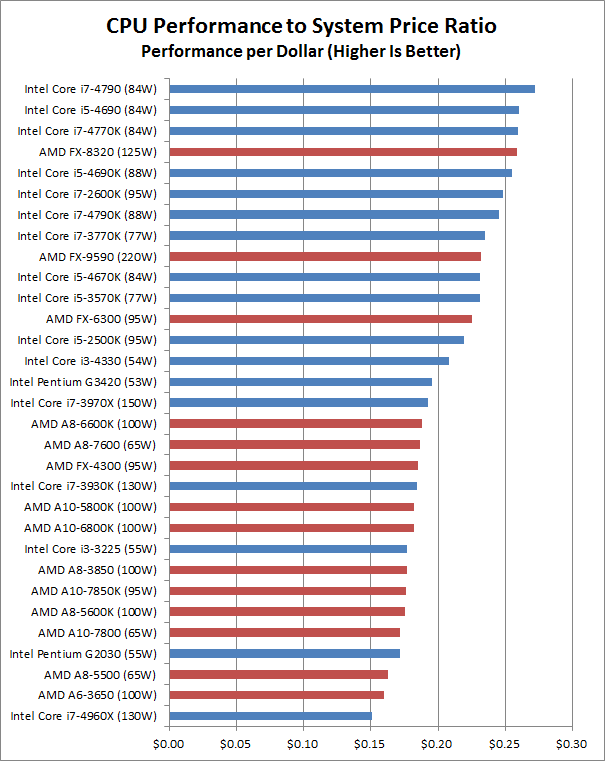
Naturally, there's one other element that needs to be considered: the price of the parts. Intel holds the crown for the fastest CPU performance, but if we just look at the cost of the CPUs/APUs and how much you pay for a certain level of performance the story is quite different. Not surprisingly, the least expensive processors tend to look the best here. However, processors don't exist in a vacuum – they're only a portion of the total system cost – so we really need to add in a baseline price for the rest of a system. If you purchase a motherboard, RAM, SSD, case, and PSU it will tack on $350-$510. I used the base set of components from the recent Budget PC Guide (minus the HDD), and then chose reasonable motherboards for the various platforms ($75 for FM2/FM2+, $80 for AM3+, $100 for LGA1155, $90 for LGA1150, and $225 for LGA2011 with $10 extra on RAM to get 4x2GB instead of 2x4GB). You could certainly spend a lot more on system components, but while less expensive motherboards exist for some of the platforms, I'm a bit wary of any motherboard priced under $70. The result is that the minimum cost for an entire system ends up being around $425-$500 for the less expensive CPUs/APUs, and $600 for something like the i5-4690K, $670-$705 for Core i7 LGA1150 systems, and as much as $1559 for the i7-4960X. Using the complete system prices (including a $50 discrete GPU on the AM3+ and LGA2011 systems), the performance to price charts look as follows:
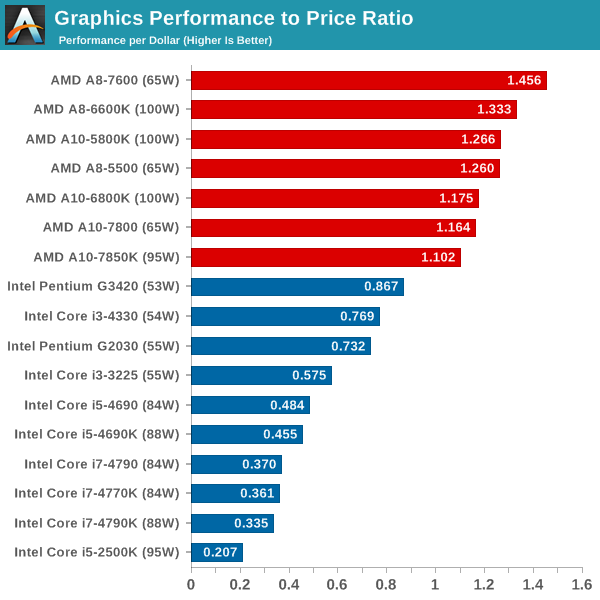
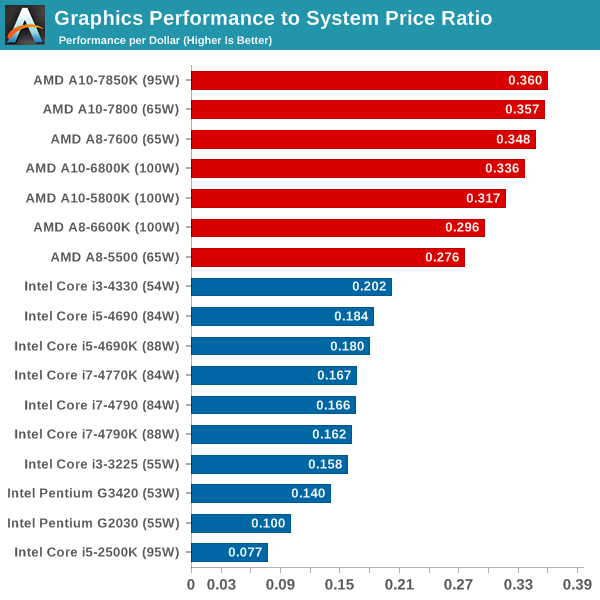
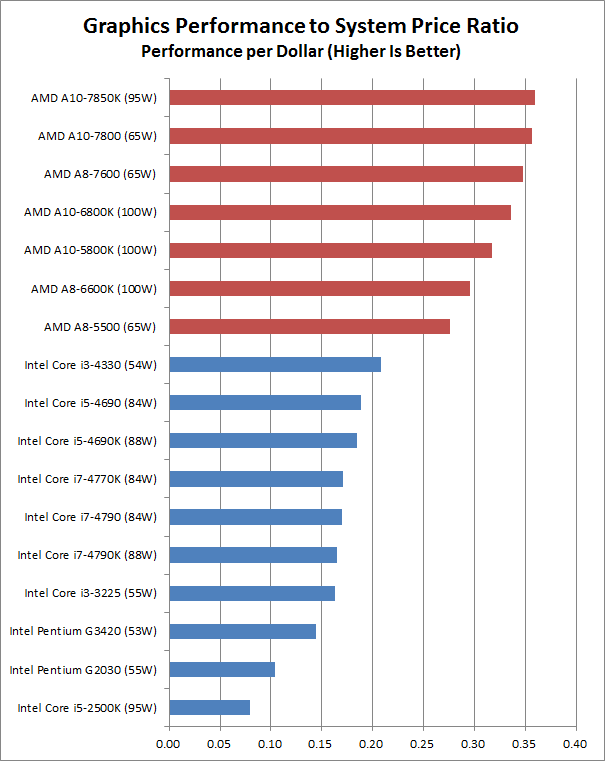
Now we're back to Intel holding on to the top spots, and interestingly it's the more expensive CPUs that take the lead. AMD's FX-8320 makes a decent showing, though the need for a discrete GPU drops it to seventh place overall. The difference in relative value between the best and worst processors becomes far less pronounced, on both the CPU and graphics charts, though AMD continues to lead on graphics performance. (Again, toss in a moderate dedicated GPU and it would be a different story.) We've also left out any consideration of power requirements, which don't necessarily match up with the TDPs we've listed. In general, the latest APUs from AMD (Trinity, Richland, or Kaveri) and the latest CPUs from Intel (Ivy Bridge and Haswell) all have similar idle power draw, so unless you're looking at the AM3+ or LGA2011 platforms power isn't a primary consideration. If you want a recommendation based on the above information, the short summary is that Intel's latest Haswell CPUs – the i7-4790 and i5-4690 – continue to be my two favorites, with overclockers getting a recommendation to spend a bit more for the Devil's Canyon i7-4790K or i5-4690K. If you're opposed to buying Intel, the price of Kaveri APUs right now is higher than I'd like, and the FX-8320 is still a potent CPU for certain workloads (and it has four modules with eight cores compared to two modules and four cores for the fastest APUs). Even so, unless you specifically need the additional CPU cores, I'm more inclined to go with a Kaveri or Richland APU. The A8-7600 is probably the best balance of performance and price, but if you want the best on-die graphics solution the A10-7800 and A10-7850K are right in the same relative range for relative value. Update: I modified the charts and improved the system price estimates, and the results are reflected in the above graphs. I also updated the text slightly to reflect these changes. If you want to see the original charts (which had slightly different system price estimates), here are the links: Average CPU Performance, Average Graphics Perfomance, CPU Performance to Price, Graphics Performance to Price, CPU Performance to System Price, and Graphics Performance to System Price. |


| << Previous Day |
2014/08/05 [Calendar] |
Next Day >> |