[Most Recent Entries] [Calendar View]
Thursday, June 13th, 2019
| Time | Event |
| 8:00a | A Subway Map of Human Anatomy: All the Systems of Our Body Visualized in the Style of the London Underground
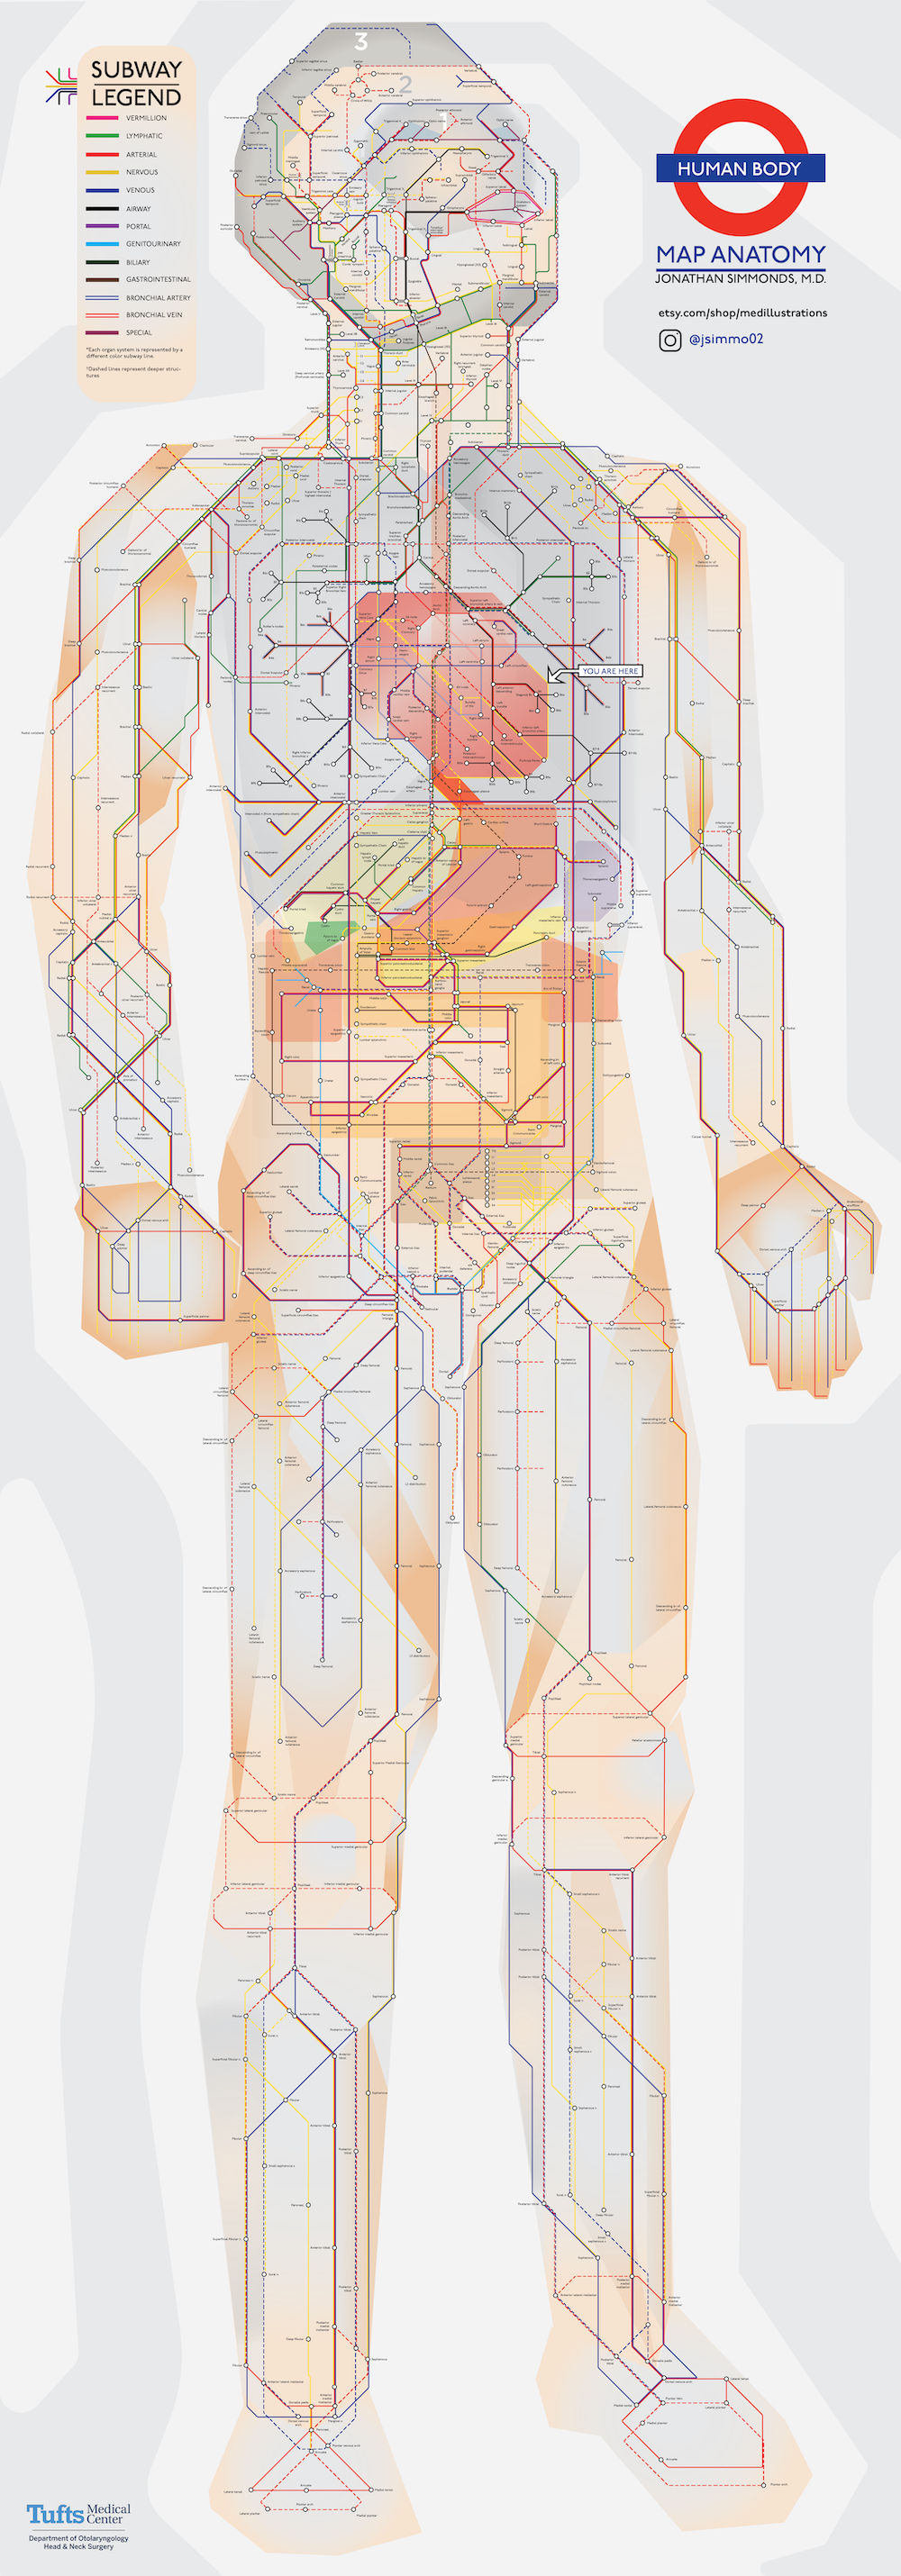
We all have bodies, but how many of us truly know our way around them? Plenty of books explain in detail the functions of and relationships between each and every part of our anatomy, but few of them do it in a way the layman — and especially the layman not yet accustomed to the sight of human viscera laid bare — can readily grasp. We need a visualization of the human body, but what kind of visualization can best represent it with a maximum of clarity and a minimum of misleading distortion? "Most people might imagine an intricate network of blood vessels or the complex neural circuits of the brain," writes Visual Capitalist's Iman Ghosh. "Or we might picture diagrams from the iconic medical textbook, Gray’s Anatomy." But how about a visualization of the body in the style of a classic piece of information design we've all seen at least once, the London Underground map? "Created by Jonathan Simmonds M.D., a resident physician at Tufts Medical Center," Ghosh writes, "it’s a simple yet beautifully intuitive demonstration of how efficiently our bodies work." Just as Harry Beck's original 1933 London Underground map straightened out and color-coded each of the lines then in operation, Simmonds' anatomical map traces thirteen different "lines" through the body, each of which represents a different system of the body: the nervous system in yellow, for example, the airway system in black, and the lymphatic system in green. "While dashed lines represent deeper structures, sections with ‘transfers’ show where different organ systems intersect," Ghosh writes. If you're wondering where to start, she adds, "there’s a helpful 'You Are Here' at the heart." You can take a close look at Simmonds' work in a large, high-resolution version here. Not only does following the model of the London Underground map introduce a degree of immediate legibility seldom seen (at least by non-medical students) in anatomical diagrams, it also underscores an aspect of the very nature of our human bodies that we don't often consider. We might instinctively think of them as sets of discrete organs all encased together and functioning independently, but in fact they're more like cities: just as busy, just as interconnected, just as dependent on connections and routines, and just as improbably functional. Related Content: Download the Sublime Anatomy Drawings of Leonardo da Vinci: Available Online, or in a Great iPad App The Roman Roads of Britain Visualized as a Subway Map A Wonderful Archive of Historic Transit Maps: Expressive Art Meets Precise Graphic Design Based in Seoul, Colin Marshall writes and broadcasts on cities, language, and culture. His projects include the book The Stateless City: a Walk through 21st-Century Los Angeles and the video series The City in Cinema. Follow him on Twitter at @colinmarshall, on Facebook, or on Instagram. A Subway Map of Human Anatomy: All the Systems of Our Body Visualized in the Style of the London Underground is a post from: Open Culture. Follow us on Facebook, Twitter, and Google Plus, or get our Daily Email. And don't miss our big collections of Free Online Courses, Free Online Movies, Free eBooks, Free Audio Books, Free Foreign Language Lessons, and MOOCs. |
| 2:00p | Atheists & Agnostics Also Frequently Believe in the Supernatural, a New Study Shows
To be a non-believer in some parts of the world, and in much of Europe for many centuries, means to commit a crime against the state. Even where unbelief goes unpunished by the law, “atheists, agnostics, and other non-believers,” writes Scotty Hendricks at Big Think, “are among the most disliked, untrusted, and misunderstood people.” Identified with Satanists (who are equally misunderstood), non-believers are presumed to be anti-theists, hell bent on destroying, or at least maiming, religion with their know-it-all dogmatism and hatred of different beliefs.
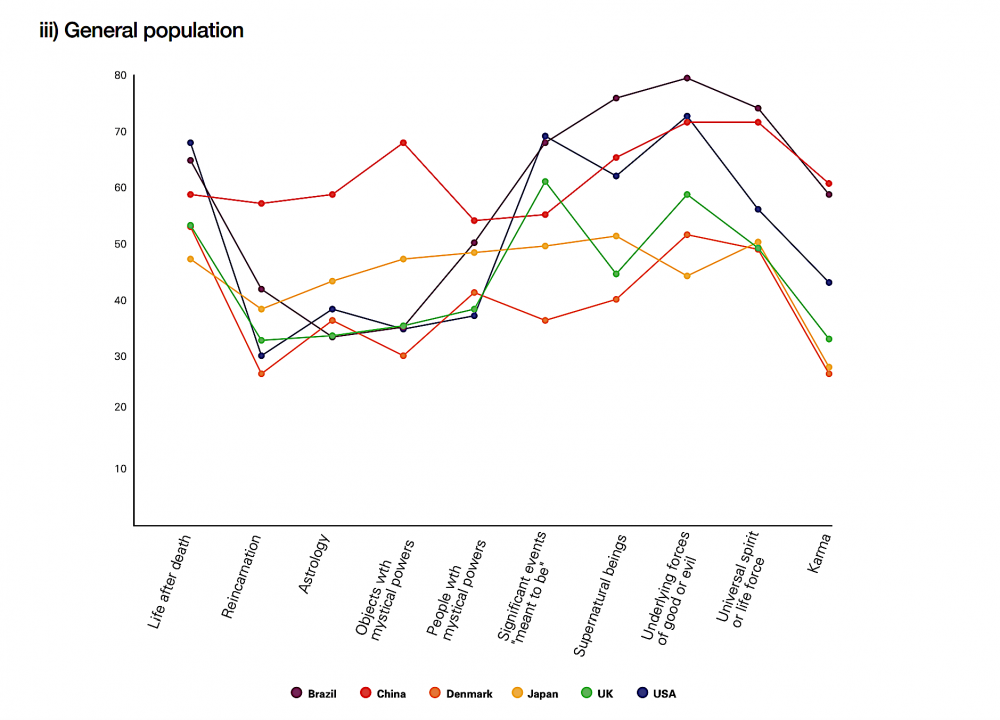
There may be some projection going on here, and maybe it goes both ways at times, though the balance of power, at least in the U.S., decidedly tips in favor of certain dogmatic religions. But as a new whitepaper from the UK group Understanding Unbelief found, in a wide-ranging survey of non-believers in six countries around the world, “popular assumptions about ‘convinced, dogmatic atheists’ do not stand up to scrutiny.” The outlier here is the religiously inflamed U.S. “Although American atheists are typically fairly confident in their views about God, importantly, so too are Americans in general.” The paper’s authors are professors in theology, psychology, anthropology, and religious studies from four major U.K. Universities. They outline their eight key findings at the outset, then get into specifics about what the data says and how it was obtained, with large, full-color charts and graphs. The study shows more agreement than most of us might assume between the religious and non-religious on “the values most important for ‘finding meaning in the world and your own life.’” “Family” and “Freedom” ranked highly. “Less unanimously so,” did “’Compassion,’ ‘Truth,’ ‘Nature,’ and ‘Science,’” which may come as little surprise. The social and political identifications of non-believers fluctuate widely between the six countries—Brazil, Denmark, Japan, China, the U.S., and the U.K.—but, “with only a few exceptions, atheists and agnostics endorse the realities of objective moral values, human dignity, and attendant rights, and the ‘deep value’ of nature.”
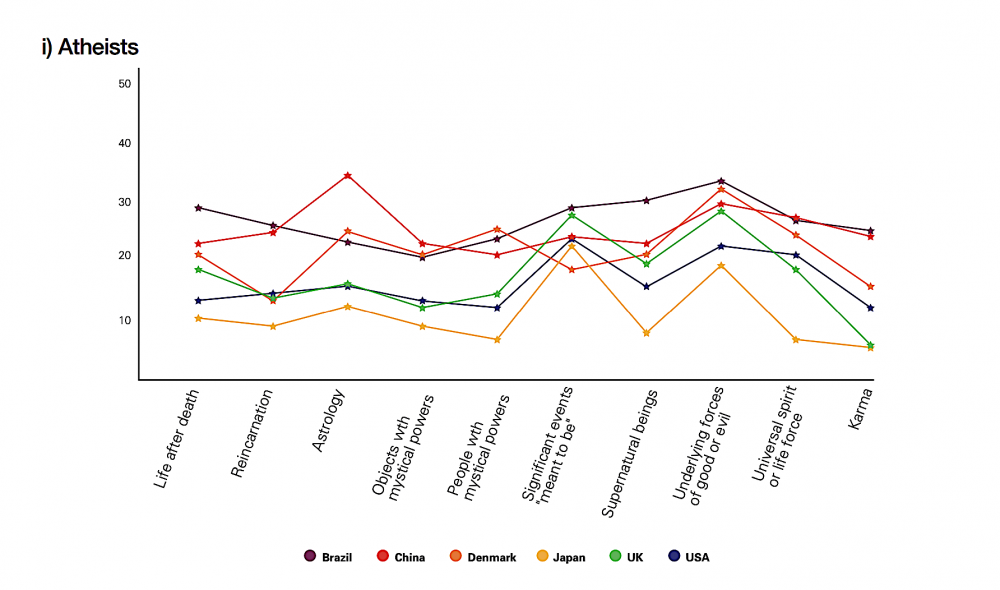
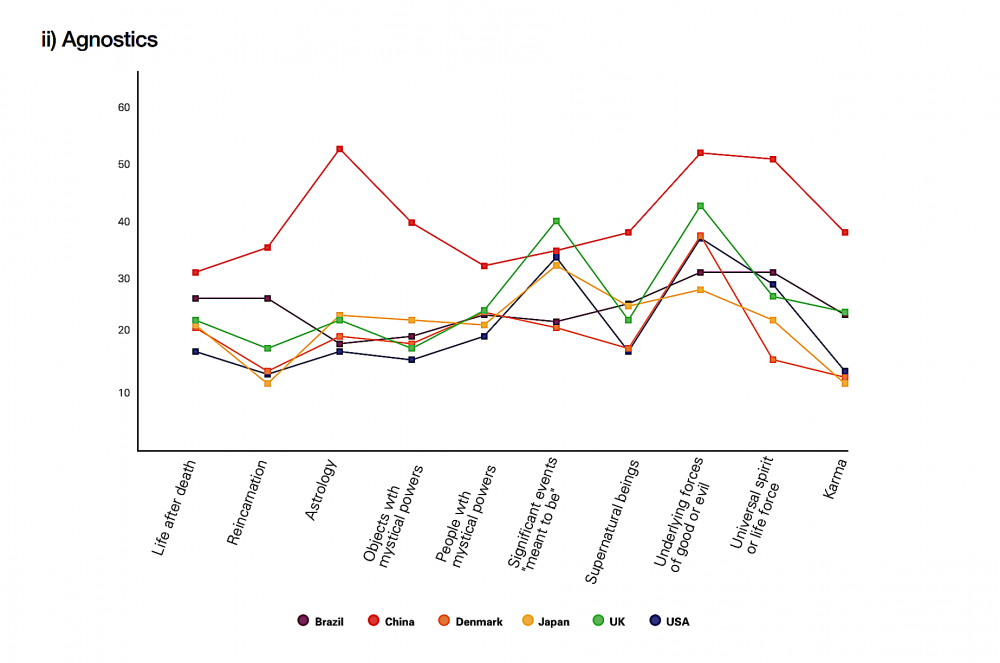
These conclusions should interest non-believers and believers alike in the six countries surveyed, but the most sensational research finding states that “despite rejecting or at least questioning the notion of gods, unbelievers aren’t wholly divorced from superstitious belief,” writes Hendricks. The study’s authors put things in a more measured way: “only minorities of atheists or agnostics in each of our countries appear to be thoroughgoing naturalists,” ruling out the supernatural entirely. Hendricks lists some examples:
These findings might be consistent with the study’s methodology, which surveyed people who agreed with either 1. I don’t believe in God [or other divinity or spirit] or 2. I don’t know whether there is a God, and I don’t believe there is any way to find out. Neither of these mutually excludes the à la carte spiritualism of astrology, reincarnation, or magic, a fact that many religious believers cannot wrap their heads around. In the 19th and early 20th centuries, for example, belief in seances, tarot, mesmerism, and other seemingly supernatural phenomena flourished, quite often independently of particular religious belief systems. One of the most rational minds of the time, or the creator of the most rational mind of the time, Sir Arthur Conan Doyle, believed in fairies. Pierre Curie “was an atheist who had an enduring, somewhat scientific, interest in spiritualism.”
The study’s findings are “in line,” Hendricks points out, “with previous studies that show non-believers are just as prone to irrational thinking as their religious counterparts.” Significant percentages of atheists and agnostics express some belief in astrology, karma, "a universal spirit or life force," and other supernatural phenomena. Hendricks quotes Michio Kaku’s suggestion that there may be “a gene for superstition, a gene for hearsay, a gene for magic.” I don’t believe geneticists have found such a thing. But culture, at any rate, is not reducible to biology. The fact that humans see, hear, feel, and believe things that may not actually exist seems to be an evolutionary trait. What may be equally, if not more, interesting is the way those supernatural things, whatever they are, both resemble and vastly differ from each other, their cultural specificities woven inextricably into the texture of language and custom. What and how we think cannot be fully separated either from our genes or from the conceptual apparatus we inherit, and that forms our picture of the world. Read the full Understanding Unbelief study here. Related Content: A Visual Map of the World’s Major Religions (and Non-Religions) Christianity Through Its Scriptures: A Free Course from Harvard University Josh Jones is a writer and musician based in Durham, NC. Follow him at @jdmagness Atheists & Agnostics Also Frequently Believe in the Supernatural, a New Study Shows is a post from: Open Culture. Follow us on Facebook, Twitter, and Google Plus, or get our Daily Email. And don't miss our big collections of Free Online Courses, Free Online Movies, Free eBooks, Free Audio Books, Free Foreign Language Lessons, and MOOCs. |
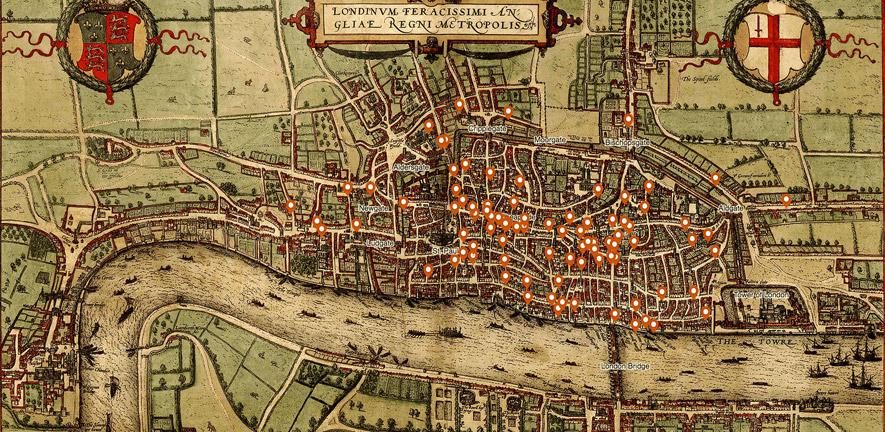
| 5:27p | New Interactive “Murder Map” Reveals the Meanest Streets of Medieval London
How dangerous was medieval London? That’s a question that has recently been studied by the University of Cambridge’s Violence Research Center, and they have provided a handy interactive map for our perusal. Just in case we go back in time in a TARDIS or some such machine, we’ll know what parts of the city to avoid. And those parts are...well, most of it, actually. The data containing info of 142 homicides comes from surviving coroner’s rolls from the first half of the 14th century. A coroner during this time was a bit closer to a police detective in ours, called to the scene of any sudden and unnatural death. And if it looked liked foul play a neighborhood jury of somewhere between 12 and 50 people were called to offer a verdict. Hover over a marker on the map and you can discover what happened at that location. Here are a few examples: On the evening of July 20, 1325, Peter Clark, a baker, was stabbed in the heart by a fellow baker called Walter after an argument. Walter took sanctuary in a church, confessed to the crime, and a month later made his way out of the country by boat. On December 21, 1325, Roger Scott, a tailor, was quarreling with Robert de Oundle in the streets of Bishopgate, when Robert stabbed Roger with a hidden knife, killing him instantly. He also fled, to where nobody knew. On February 13, 1324, William Warrock and William de Northamptone were arguing in the high street of Castle Baynard, when the former stabbed the latter in the heart. Warrock, who had no belongings, disappeared. Sensing a theme here? We’ll never know the reason for these fatal altercations, but the knife industry was doing well out of it. The study crunched the numbers and found some statistics: the time of year did not seem to be a factor, but like today, the weekend was a deadlier time. And the hours between early evening and the first hour of London’s curfew, when the city insisted all fires be extinguished and people go to bed. A whopping 52% of murders happened in the public square or the high street. No other location cracks 10%. And long knives were the weapon of choice at 35%, second only to short knives at 20%. And though it wasn’t reflected in the three random examples, most people got stabbed in the head. Unsurprisingly men committed the majority of the crimes, and all classes of society and profession murdered their way around London, including priests. (One example is given of a priest who stabs a gardener to death when the latter discovered him stealing apples.) Professor and criminologist Manuel Eisner summed up the work of his group thus: “The events described in the Coroners’ Rolls show weapons were never far away, male honour had to be protected, and conflicts easily got out of hand. They give us a detailed picture of how homicide was embedded in the rhythms of urban medieval life.” And in fact, given the proportion of crime to the general population, London was pretty deadly, about 15-20 times higher than a modern British city. But Eisner notes the comparisons can only go so far: “We have firearms, but we also have emergency services. It’s easier to kill but easier to save lives.” Visit the interactive medieval murder map here. Related Content: An Interactive Map Shows Just How Many Roads Actually Lead to Rome An Interactive Map of Odysseus’ 10-Year Journey in Homer’s Odyssey Ted Mills is a freelance writer on the arts who currently hosts the artist interview-based FunkZone Podcast and is the producer of KCRW's Curious Coast. You can also follow him on Twitter at @tedmills, read his other arts writing at tedmills.com and/or watch his films here. New Interactive “Murder Map” Reveals the Meanest Streets of Medieval London is a post from: Open Culture. Follow us on Facebook, Twitter, and Google Plus, or get our Daily Email. And don't miss our big collections of Free Online Courses, Free Online Movies, Free eBooks, Free Audio Books, Free Foreign Language Lessons, and MOOCs. |
| 7:00p | An Interactive Map of Odysseus’ 10-Year Journey in Homer’s Odyssey
The Odyssey, one of Homer's two great epics, narrates Odysseus' long, strange trip home after the Trojan war. During their ten-year journey, Odysseus and his men had to overcome divine and natural forces, from battering storms and winds to difficult encounters with the Cyclops Polyphemus, the cannibalistic Laestrygones, the witch-goddess Circe and the rest. And they took a most circuitous route, bouncing all over the Mediterranean, moving first down to Crete and Tunisia. Next over to Sicily, then off toward Spain, and back to Greece again. If you're looking for an easy way to visualize all of the twists and turns in The Odyssey, then we'd recommend spending some time with the interactive map created by Gisèle Mounzer. "Odysseus' Journey" breaks down Odysseus' voyage into 14 key scenes and locates them on a modern map designed by Esri, a company that creates GIS mapping software. Meanwhile, if you're interested in the whole concept of ancient travel, we'd suggest revisiting one of our previous posts: Play Caesar: Travel Ancient Rome with Stanford’s Interactive Map. It tells you all about ORBIS, a geospatial network model, that lets you simulate journeys in Ancient Roman. You pick the points of origin and destination for a trip, and ORBIS will reconstruct the duration and financial cost of making the ancient journey. Would you like to support the mission of Open Culture? Please consider making a donation to our site. It's hard to rely 100% on ads, and your contributions will help us continue providing the best free cultural and educational materials to learners everywhere. Also consider following Open Culture on Facebook and Twitter and sharing intelligent media with your friends. Or sign up for our daily email and get a daily dose of Open Culture in your inbox. Note: An earlier version of this post appeared on our site in December, 2013. Related Content: Hear Homer’s Iliad Read in the Original Ancient Greek What Ancient Greek Music Sounded Like: Hear a Reconstruction That is ‘100% Accurate’ Discover the “Brazen Bull,” the Ancient Greek Torture Machine That Doubled as a Musical Instrument Learning Ancient History for Free An Interactive Map of Odysseus’ 10-Year Journey in Homer’s Odyssey is a post from: Open Culture. Follow us on Facebook, Twitter, and Google Plus, or get our Daily Email. And don't miss our big collections of Free Online Courses, Free Online Movies, Free eBooks, Free Audio Books, Free Foreign Language Lessons, and MOOCs. |


| << Previous Day |
2019/06/13 [Calendar] |
Next Day >> |