|
|
| Пишет iv_g ( @ 2011-12-16 12:45:00 |
|
|
|
|
|
|
|
|
|
|
|
|
|
|
Оман: обзор экономики
Оман
Area - Total 309,501 km2
Population
- 2010 estimate 3,608,545
- 2003 census 2,341,000
GDP (nominal) 2010 estimate
- Total $55.620 billion
- Per capita $18,657
http://en.wikipedia.org/wiki/Oman

http://en.wikipedia.org/wiki/Demographi
Exports $33.9 billion f.o.b. (2008 est.)
Imports $13.32 billion f.o.b. (2008 est.)
Public debt 2.4% of GDP (2008 est.)
Revenues $18.41 billion (2008 est.)
Expenses $14.74 billion (2008 est.)
Oil was first discovered in the interior near Fahud in the western desert in 1964. Petroleum Development Oman (PDO) began production in August 1967. The Omani Government owns 60% of PDO, and foreign interests own 40% (Royal Dutch Shell owns 34%; the remaining 6% is owned by Compagnie Francaise des Petroles [Total] and Partex). In 1976, Oman's oil production rose to 366,000 barrels (58,000 m³) per day but declined gradually to about 285,000 barrels (45,000 m³) per day in late 1980 due to the depletion of recoverable reserves. From 1981 to 1986,
Oman compensated for declining oil prices, by increasing production levels to 600,000 b/d. With the collapse of oil prices in 1986, however, revenues dropped dramatically. Production was cut back temporarily in coordination with the Organization of Petroleum Exporting Countries (OPEC), and production levels again reached 600,000 b/d by mid-1987, which helped increase revenues. By mid-2000, production had climbed to more than 900,000 b/d where they remain. Oman is not a member of OPEC.
Natural gas reserves, which will increasingly provide the fuel for power generation and desalination, stand at 18 trillion ft³ (510 km³). The Oman LNG processing plant located in Sur was opened in 2000, with production capacity of 6.6 million tons/YR, as well as unsubstantial gas liquids, including condensates.
http://en.wikipedia.org/wiki/Economy_of
Oil rents (% of GDP) in Oman

http://www.tradingeconomics.com/oman/oi
Oman GDP at current prices in US dollars
The GDP at current prices in US dollars in Oman was reported at 53.40 billions U.S. dollars in 2009, according to the International Monetary Fund (IMF)

http://www.tradingeconomics.com/oman/gd
GNI; Atlas method (US dollar) in Oman

http://www.tradingeconomics.com/oman/gn
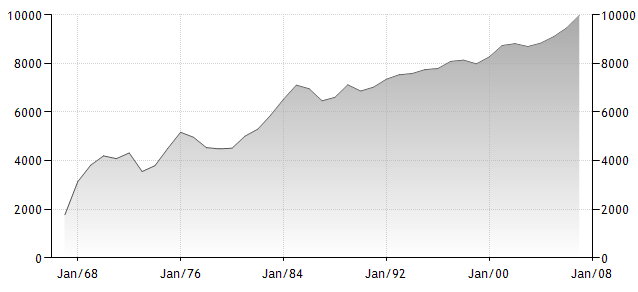
1. Oman GDP per Capita at current prices in US dollars

http://www.tradingeconomics.com/oman/gd
GDP per capita (constant 2000 US dollar) in Oman
http://www.tradingeconomics.com/oman/gd
2. Oman Inflation average

http://www.tradingeconomics.com/oman/in
3. Oman Current account balance in percent of GDP

http://www.tradingeconomics.com/oman/cu
4. Rural population (% of total population) in Oman

http://www.tradingeconomics.com/oman/ru
Population ages 0-14 (% of total) in Oman

http://www.tradingeconomics.com/oman/po
5. Armed forces personnel; total in Oman

http://www.tradingeconomics.com/oman/ar
Military expenditure (% of GDP) in Oman

http://www.tradingeconomics.com/oman/mi
Military expenditure (% of central government expenditure) in Oman

http://www.tradingeconomics.com/oman/mi
Military expenditure (current LCU) in Oman

http://www.tradingeconomics.com/oman/mi
6. Total reserves (includes gold; US dollar) in Oman

http://www.tradingeconomics.com/oman/to
7. Energy use (kg of oil equivalent per capita) in Oman

http://www.tradingeconomics.com/oman/en
8. External balance on goods and services (% of GDP) in Oman

http://www.tradingeconomics.com/oman/ex
9. Gross savings (% of GDP) in Oman
Gross savings are calculated as gross national income less total consumption, plus net transfers.

http://www.tradingeconomics.com/oman/gr
Оман
Area - Total 309,501 km2
Population
- 2010 estimate 3,608,545
- 2003 census 2,341,000
GDP (nominal) 2010 estimate
- Total $55.620 billion
- Per capita $18,657
http://en.wikipedia.org/wiki/Oman
http://en.wikipedia.org/wiki/Demographi
Exports $33.9 billion f.o.b. (2008 est.)
Imports $13.32 billion f.o.b. (2008 est.)
Public debt 2.4% of GDP (2008 est.)
Revenues $18.41 billion (2008 est.)
Expenses $14.74 billion (2008 est.)
Oil was first discovered in the interior near Fahud in the western desert in 1964. Petroleum Development Oman (PDO) began production in August 1967. The Omani Government owns 60% of PDO, and foreign interests own 40% (Royal Dutch Shell owns 34%; the remaining 6% is owned by Compagnie Francaise des Petroles [Total] and Partex). In 1976, Oman's oil production rose to 366,000 barrels (58,000 m³) per day but declined gradually to about 285,000 barrels (45,000 m³) per day in late 1980 due to the depletion of recoverable reserves. From 1981 to 1986,
Oman compensated for declining oil prices, by increasing production levels to 600,000 b/d. With the collapse of oil prices in 1986, however, revenues dropped dramatically. Production was cut back temporarily in coordination with the Organization of Petroleum Exporting Countries (OPEC), and production levels again reached 600,000 b/d by mid-1987, which helped increase revenues. By mid-2000, production had climbed to more than 900,000 b/d where they remain. Oman is not a member of OPEC.
Natural gas reserves, which will increasingly provide the fuel for power generation and desalination, stand at 18 trillion ft³ (510 km³). The Oman LNG processing plant located in Sur was opened in 2000, with production capacity of 6.6 million tons/YR, as well as unsubstantial gas liquids, including condensates.
http://en.wikipedia.org/wiki/Economy_of
Oil rents (% of GDP) in Oman
http://www.tradingeconomics.com/oman/oi
Oman GDP at current prices in US dollars
The GDP at current prices in US dollars in Oman was reported at 53.40 billions U.S. dollars in 2009, according to the International Monetary Fund (IMF)
http://www.tradingeconomics.com/oman/gd
GNI; Atlas method (US dollar) in Oman
http://www.tradingeconomics.com/oman/gn
1. Oman GDP per Capita at current prices in US dollars
http://www.tradingeconomics.com/oman/gd
GDP per capita (constant 2000 US dollar) in Oman
http://www.tradingeconomics.com/oman/gd
2. Oman Inflation average
http://www.tradingeconomics.com/oman/in
3. Oman Current account balance in percent of GDP
http://www.tradingeconomics.com/oman/cu
4. Rural population (% of total population) in Oman
http://www.tradingeconomics.com/oman/ru
Population ages 0-14 (% of total) in Oman
http://www.tradingeconomics.com/oman/po
5. Armed forces personnel; total in Oman
http://www.tradingeconomics.com/oman/ar
Military expenditure (% of GDP) in Oman
http://www.tradingeconomics.com/oman/mi
Military expenditure (% of central government expenditure) in Oman
http://www.tradingeconomics.com/oman/mi
Military expenditure (current LCU) in Oman
http://www.tradingeconomics.com/oman/mi
6. Total reserves (includes gold; US dollar) in Oman
http://www.tradingeconomics.com/oman/to
7. Energy use (kg of oil equivalent per capita) in Oman
http://www.tradingeconomics.com/oman/en
8. External balance on goods and services (% of GDP) in Oman
http://www.tradingeconomics.com/oman/ex
9. Gross savings (% of GDP) in Oman
Gross savings are calculated as gross national income less total consumption, plus net transfers.
http://www.tradingeconomics.com/oman/gr