|
|
| Пишет iv_g ( @ 2010-12-18 14:00:00 |
|
|
|
|
|
|
|
|
|
|
|
|
|
|
| Entry tags: | Канада, газ, газ сжиженный, диаграмма, мир, обзор, потребление, таблица, углеводороды |
Liquefied Natural Gas - A Canadian Perspective - Energy Market Asssessment
An Energy Market Assessme nt FEBRUARY 2009
http://www.neb-one.gc.ca/clf-nsi/rnrgyn
http://www.neb-one.gc.ca/clf-nsi/rnrgyn
Conversion Factors
1 m3 gas = 35.3 cubic feet of natural gas
1 m3 LNG = 21,824 cubic feet of natural gas
1 Tonne LNG = 47,257 cubic feet of natural gas
1 Figure 1.1 - LNG Share of World Natural Gas Market
Source: BP Statistical Review of World Energy
2 Figure 1.2 - Global Natural Gas Consumption and Outlook
Source: EIA International Energy Outlook 2008
3 Figure 1.3 - Natural Gas Balance in Major Consuming Markets
Source: BP Statistical Review of World Energy
4 Figure 2.1 - Estimated Natural Gas Reserves (2007)
Source: IEA 2008
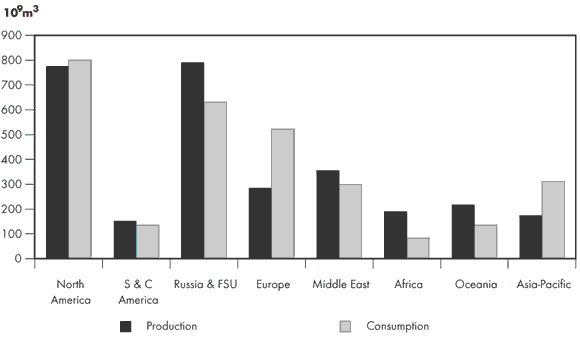
5 Figure 2.2 - World Production and Consumption of Natural Gas (2007)
Source: BP Statistical Review of World Energy
6 Figure 2.3 - Growing Reliance on Natural Gas Imports
Source: EIA International Energy Outlook 2008
7 Figure 2.4 - World LNG Production
Source: BP Statistical Review of World Energy
8 Figure 2.5 - Major LNG Producing and Consuming Regions (2007) - 109m3
Source: BP Statistical Review of World Energy
9 Figure 2.6 - World LNG Markets
Source: BP Statistical Review of World Energy
10 Figure 2.7 - East-Asia Natural Gas Balance
* Predominately From China
Source: BP Statistical Review of World Energ
11 Figure 2.8 - East-Asia Seasonal LNG Requirement
Source: Various data sources
12 Figure 2.9 - LNG Supply to Japan
Source: Japan Ministry of Finance
13 Figure 2.10 - Natural Gas Production and Consumption in Major East-Asian Countries*
* Includes Japan, South Korea and China
Source: EIA International Energy Outlook 2008, September 2008
14 Figure 2.11 - European Natural Gas Production
Source: BP Statistical Review of World Energy
15 Figure 2.12 - European Natural Gas Balance
Source: BP Statistical Review of World Energy
16 Figure 2.13 - North American Natural Gas Balance
Source: BP Statistical Review of World Energy
17 Figure 2.14 - World Market Influence on U.S. LNG Imports
* Converted to US$/MMBtu from data derived from the InterContinental Exchange (ICE) and the Japan Ministry of Finance
18 Figure 2.15 - Global LNG Liquefaction and Regasification Outlook
19 Figure 2.16 - Global LNG Liquefaction Under Construction
20 Figure 2.17 - LNG Shipping Fleet
Source: Argus and NEB estimates
21 Figure 2.18 - Atlantic Basin LNG Development
22 Figure 2.19 - Asia-Pacific Basin LNG Development
23 Figure 2.20 - Middle East LNG Liquefaction
24 Figure 3.1 - North American Natural Gas Consumption and LNG Imports
Sources: Historical from BP, Projection from EIA International Outlook 2008 with adjustment from 2009 Annual Energy Outlook
25 Figure 3.2 - U.S. LNG Imports
Source: U.S. Department of Energy
26 Figure 3.3 - Natural Gas Production and Consumption in North America
Sources: EIA International Energy Outlook 2008 and Annual Energy Outlook 2009
27 Figure 3.4 - Natural Gas Production and Consumption in Europe
Source: EIA International Energy Outlook 2008
28 Figure 3.5 - U.S. LNG Imports and Atlantic Basin Competition
Sources: Intercontinental Exchange, U.S. Department of Energy
29 Figure 3.6 - Atlantic Basin LNG Supply and North American Imports
Source: NEB estimates
30
31 Figure 4.2 - Illustrative Transportation Costs to Atlantic Basin Markets
Source: NEB
32 Figure 4.3 - New England Natural Gas Consumption and LNG Imports
Source: EIA
33 Figure 4.4 - Illustrative Transportation Costs to Asia-Pacific Basin Markets
Source: NEB
34
35
36


